Fig. 16
Download original image
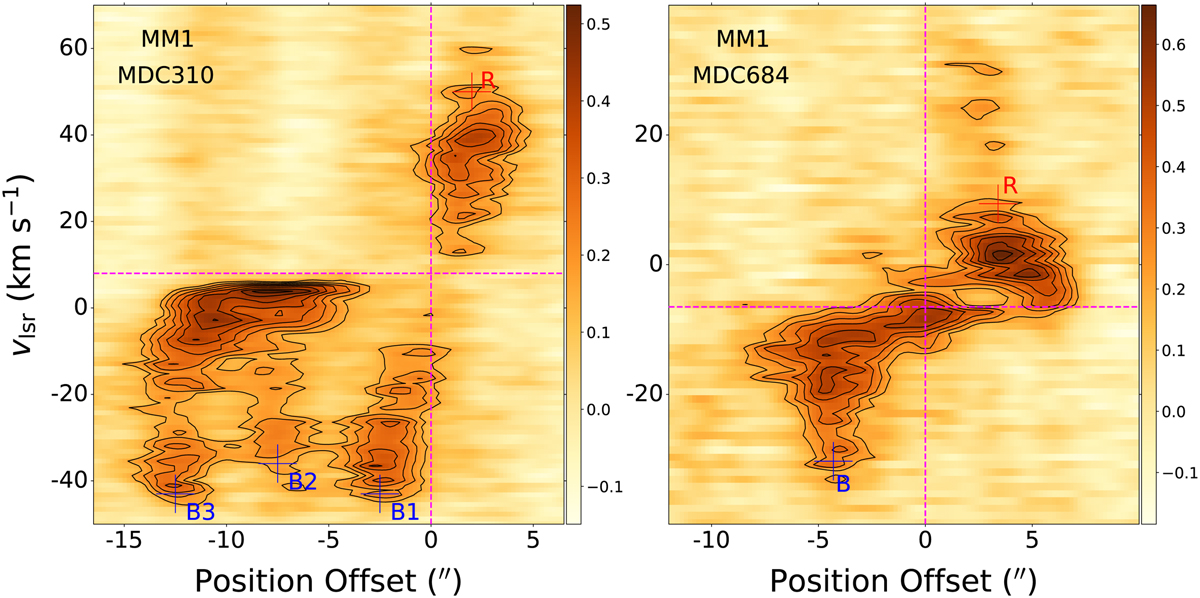
PV diagram of the SiO bipolar outflows. The cut of the PV diagrams is along the SiO outflows that are indicated by the arrows in Figs. 3a and 8a. The names of the associated continuum sources and MDCs are displayed in each panel. The red and blue plus symbols mark the locations of the detected redshifted and blueshifted knots. The vertical and horizontal dashed fuchsia lines show the positions and systemic velocities of the continuum sources, respectively. The contour levels are (3 to 30 by 3 steps) × σ, with σ = 0.05 and 0.07 Jy beam−1, for MM1 in MDC310 and 684, respectively.
Current usage metrics show cumulative count of Article Views (full-text article views including HTML views, PDF and ePub downloads, according to the available data) and Abstracts Views on Vision4Press platform.
Data correspond to usage on the plateform after 2015. The current usage metrics is available 48-96 hours after online publication and is updated daily on week days.
Initial download of the metrics may take a while.