Open Access
Fig. 14
Download original image
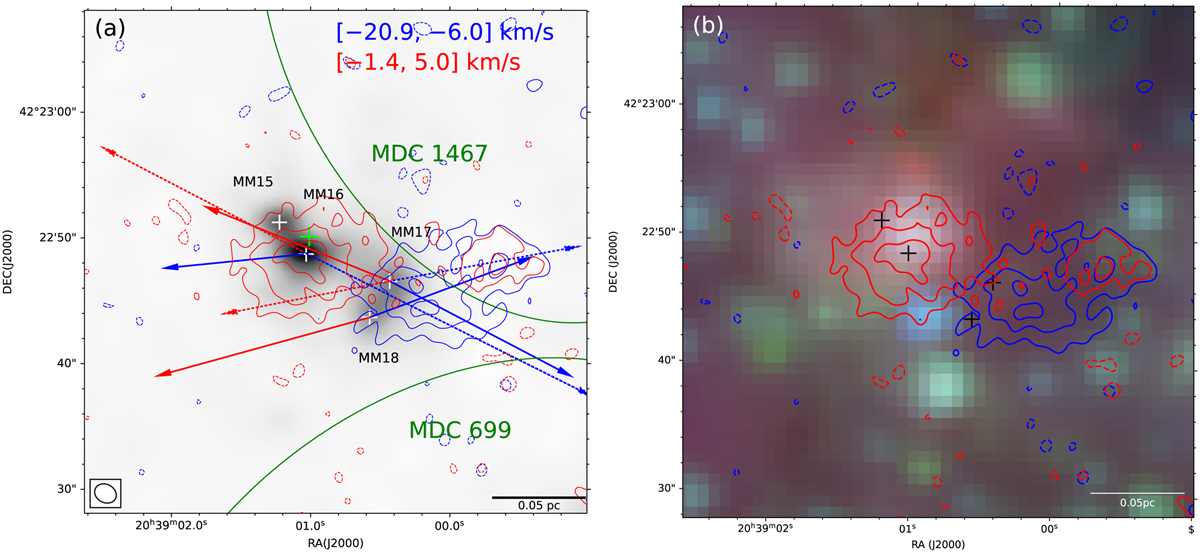
Same convention as Fig. 1 but for MDC1467. The blue contour levels are (−3, 3, 6, 9) × σ, with σ = 1.25 Jy beam−1 km s−1, and the red contour levels are (−3, 3, 6) × σ, with σ = 0.84 Jy beam−1 km s−1. (a) The green cross indicates the position of the protostar candidate identified in Kryukova et al. (2014).
Current usage metrics show cumulative count of Article Views (full-text article views including HTML views, PDF and ePub downloads, according to the available data) and Abstracts Views on Vision4Press platform.
Data correspond to usage on the plateform after 2015. The current usage metrics is available 48-96 hours after online publication and is updated daily on week days.
Initial download of the metrics may take a while.