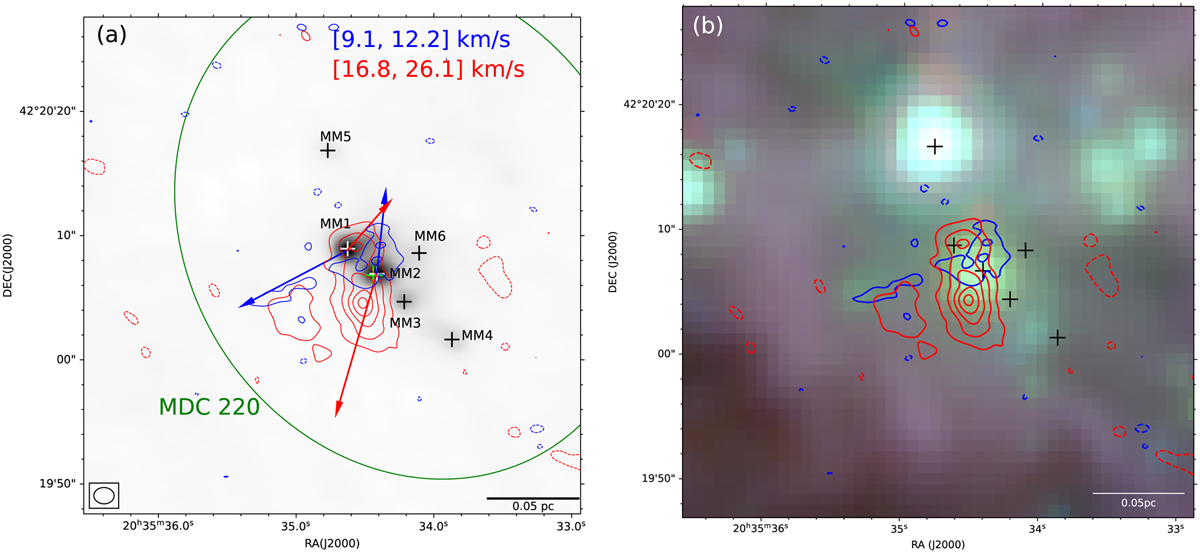
Fig. 1
Download original image
High-velocity (Δv ≥ 2.3 km s−1) SiO (5−4) emission and the Spitzer IRAC three-color map for MDC220. In each panel, a scale bar is presented at the bottom-right corner, (a) The integrated velocity ranges of the contours are presented at the top-right corner. The blue contour levels are (−3, 3, 6) × σ, with σ = 0.16 Jy beam−1 km s−1, and the red contour levels are (−3, 3, 6, 9, 12, 15) × σ, with σ = 0.30 Jy beam−1 km s−1. The grayscale maps represent 1.37 mm continuum emissions. The CO blueshifted and redshifted outflows are indicated by solid blue and red arrows following Pan et al. (2024). The black and white crosses represent dust condensations identified by Cao et al. (2021). The green cross indicates the position of the protostar candidates identified in Kryukova et al. (2014). The synthesized beam is shown in the bottom-left corner. The green solid ellipses represent the full width at half maximum (FWHM) of the MDC220 obtained from Cao et al. (2021). (b) Spitzer three-color composite image with the 3.6, 4.5, and 8.0 μm emissions coded in blue, green, and red, respectively.
Current usage metrics show cumulative count of Article Views (full-text article views including HTML views, PDF and ePub downloads, according to the available data) and Abstracts Views on Vision4Press platform.
Data correspond to usage on the plateform after 2015. The current usage metrics is available 48-96 hours after online publication and is updated daily on week days.
Initial download of the metrics may take a while.