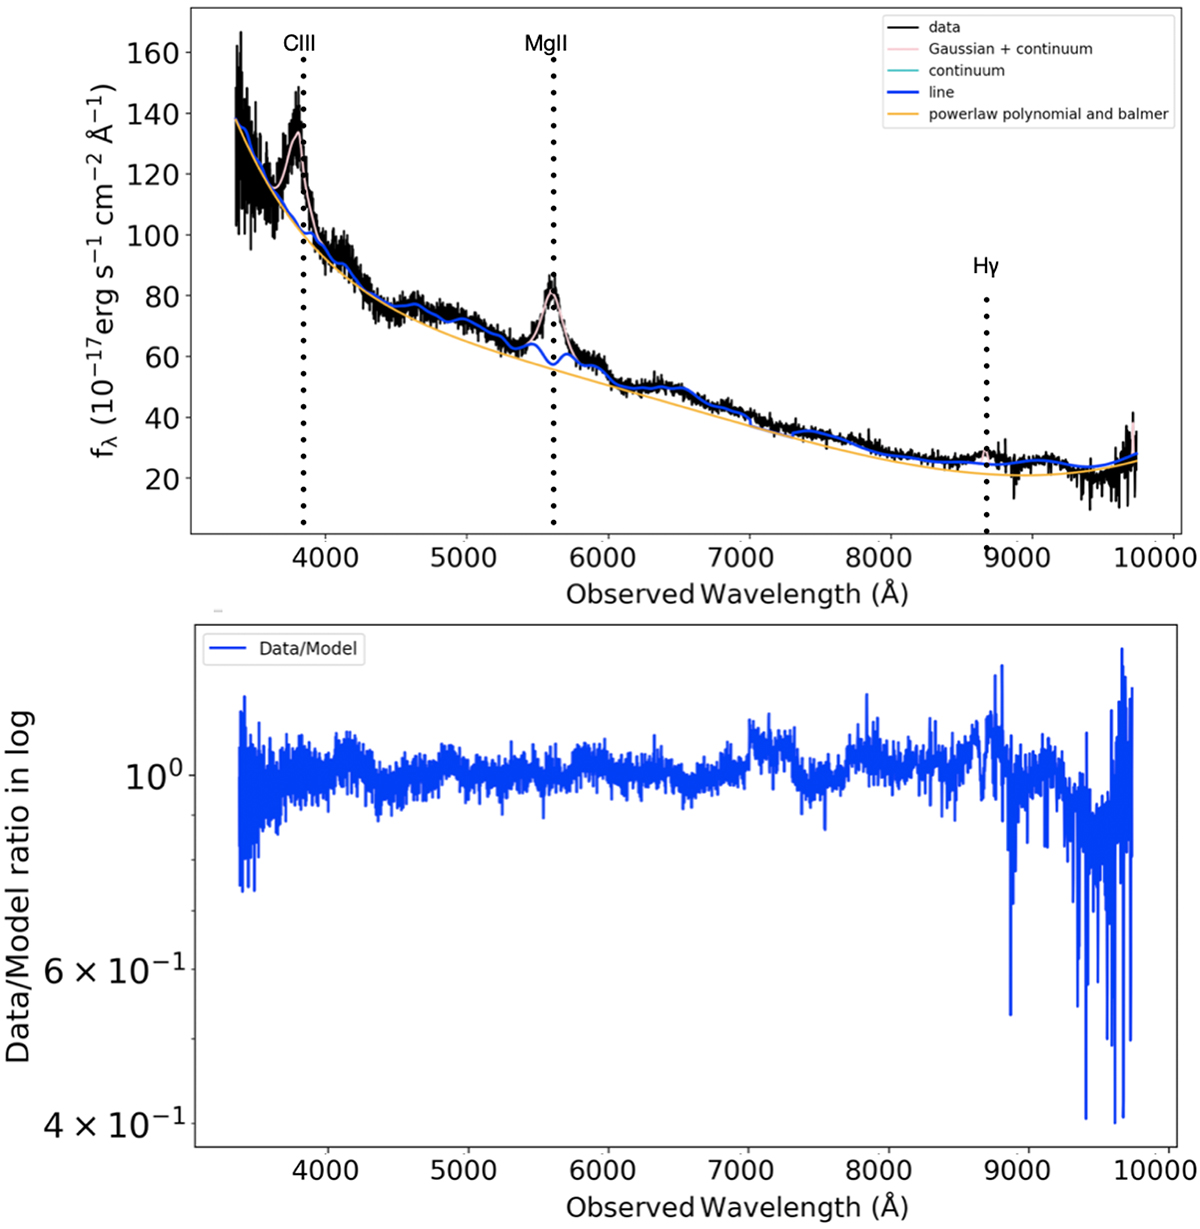
Fig. 6.
Download original image
Example observed-frame SDSS quasar spectrum and data/continuum model ratio spectra after removing the features of quasar emission and converting to unit average flux density with the package PyQSOFIT (Guo et al. 2018). On top, we show the original SDSS spectrum, with the multi-component fit performed with PyQSOFIT in colour. The bottom panel displays the resulting quasar spectrum normalised to an arbitrary value of 1 by dividing the observed spectrum by the continuum.
Current usage metrics show cumulative count of Article Views (full-text article views including HTML views, PDF and ePub downloads, according to the available data) and Abstracts Views on Vision4Press platform.
Data correspond to usage on the plateform after 2015. The current usage metrics is available 48-96 hours after online publication and is updated daily on week days.
Initial download of the metrics may take a while.