Open Access
Fig. 1.
Download original image
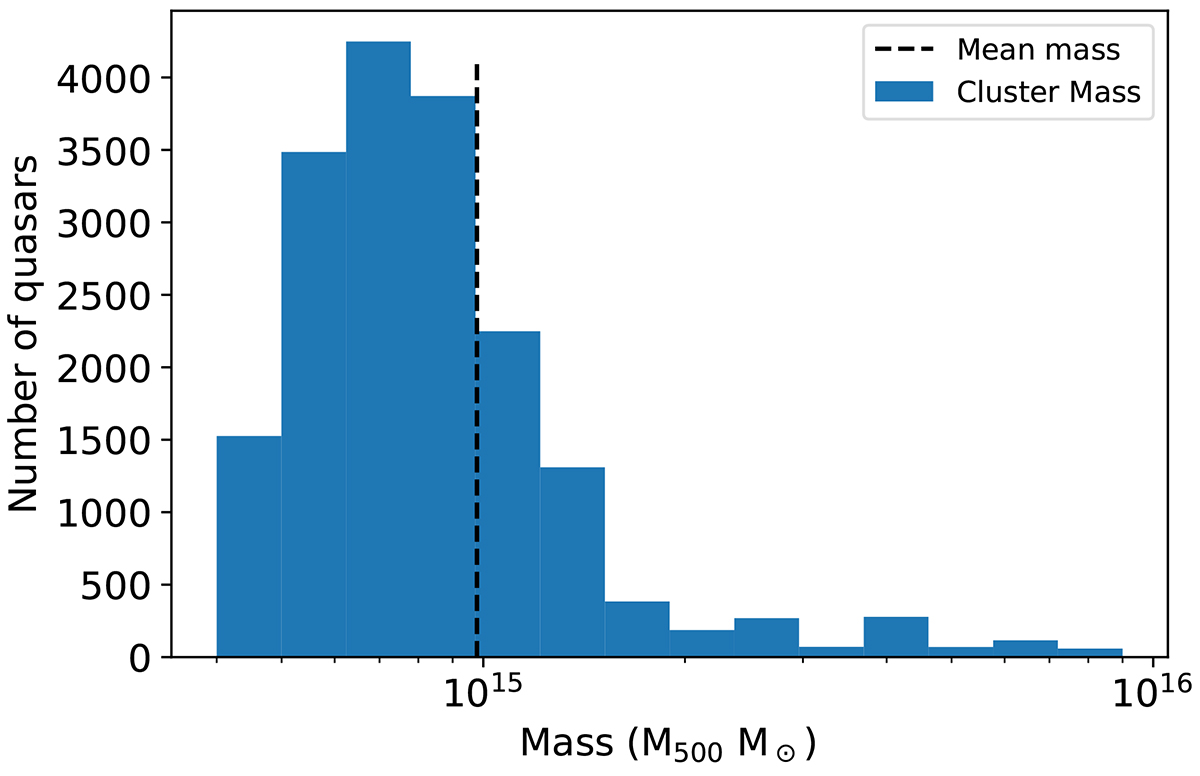
Distribution of the number of background quasar spectra of the full sample used in the analysis as a function of the foreground cluster mass within R500. The dotted line represents the mean mass of the clusters.
Current usage metrics show cumulative count of Article Views (full-text article views including HTML views, PDF and ePub downloads, according to the available data) and Abstracts Views on Vision4Press platform.
Data correspond to usage on the plateform after 2015. The current usage metrics is available 48-96 hours after online publication and is updated daily on week days.
Initial download of the metrics may take a while.