Fig. 8.
Download original image
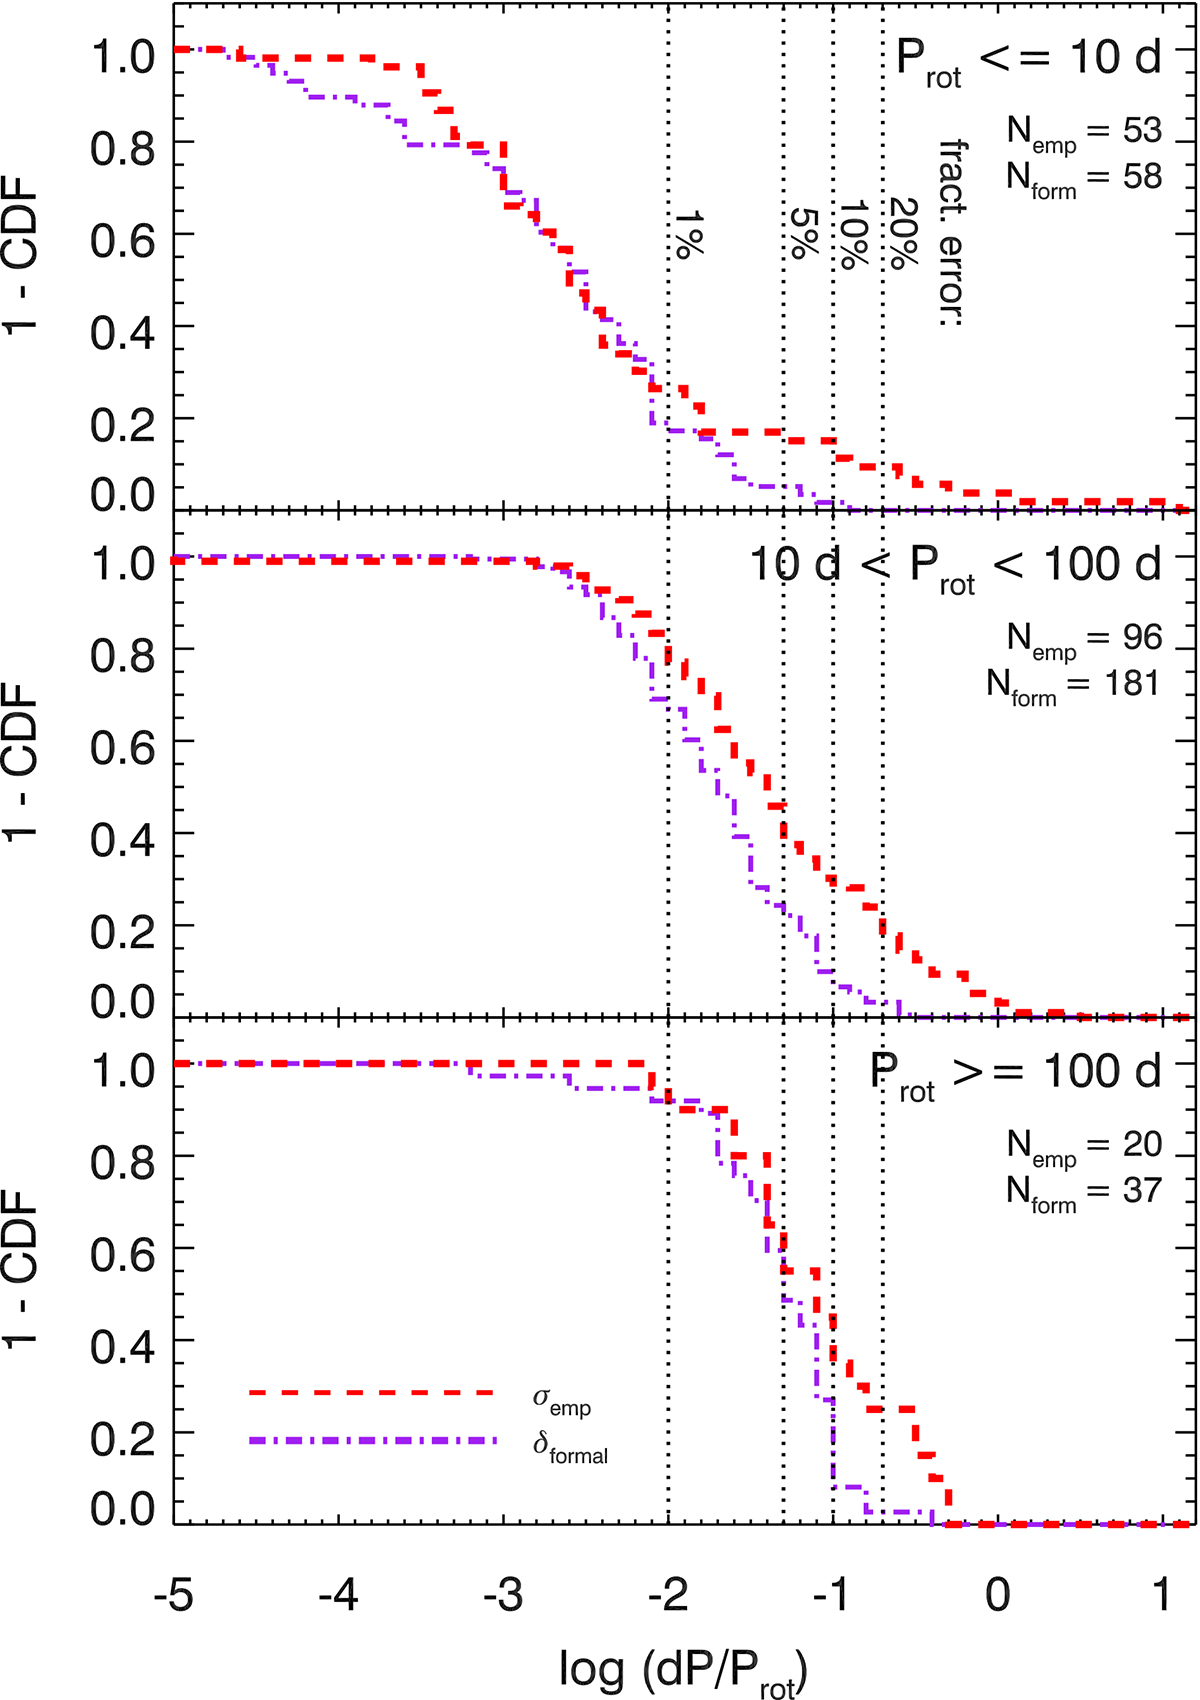
Reverse cumulative distribution of fractional period errors: comparison between ‘empirical’ (σemp, red dashed) and ‘formal’ errors (δformal, purple dot-dashed). Top: for Prot ≤ 10 d; middle: for 10 < Prot < 100 d; bottom: for Prot ≥ 100 d. The number of data points in each bin are given as Nemp for the empirical dispersion and Nform for the formal error distribution.
Current usage metrics show cumulative count of Article Views (full-text article views including HTML views, PDF and ePub downloads, according to the available data) and Abstracts Views on Vision4Press platform.
Data correspond to usage on the plateform after 2015. The current usage metrics is available 48-96 hours after online publication and is updated daily on week days.
Initial download of the metrics may take a while.