Open Access
Fig. 5.
Download original image
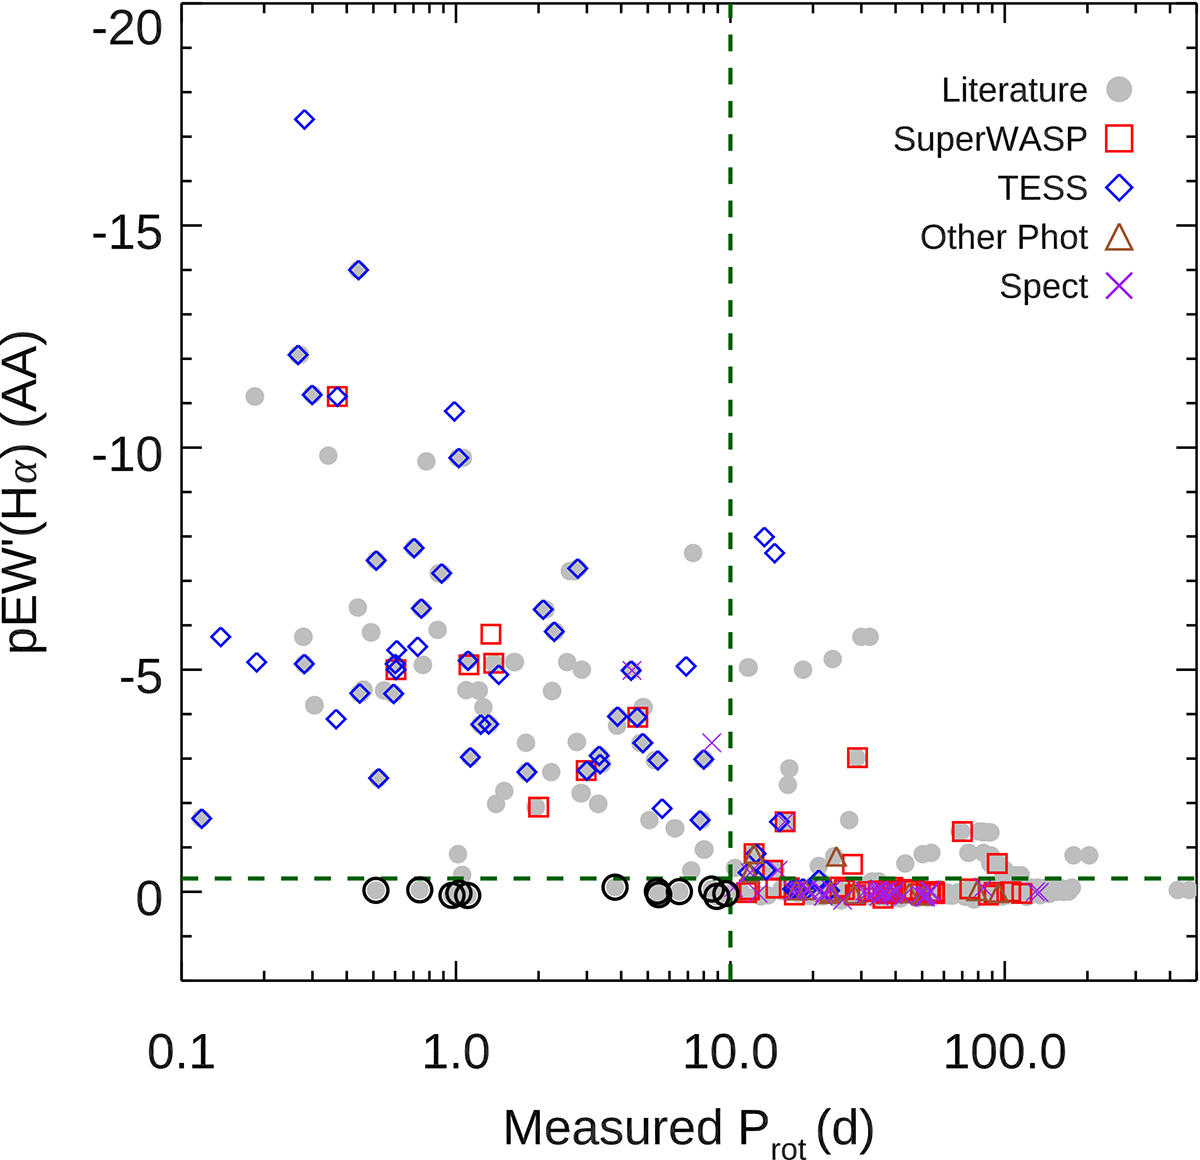
Hα pseudo-equivalent width from Schöfer et al. (2019) versus measured Prot. Symbols as in Fig. 4. The dashed green lines delineate ![]() and Prot = 10 d. Points to the lower-left of these bounds, marked with black circles, are considered to be outliers and discussed in Appendix A.3.
and Prot = 10 d. Points to the lower-left of these bounds, marked with black circles, are considered to be outliers and discussed in Appendix A.3.
Current usage metrics show cumulative count of Article Views (full-text article views including HTML views, PDF and ePub downloads, according to the available data) and Abstracts Views on Vision4Press platform.
Data correspond to usage on the plateform after 2015. The current usage metrics is available 48-96 hours after online publication and is updated daily on week days.
Initial download of the metrics may take a while.