Fig. 4.
Download original image
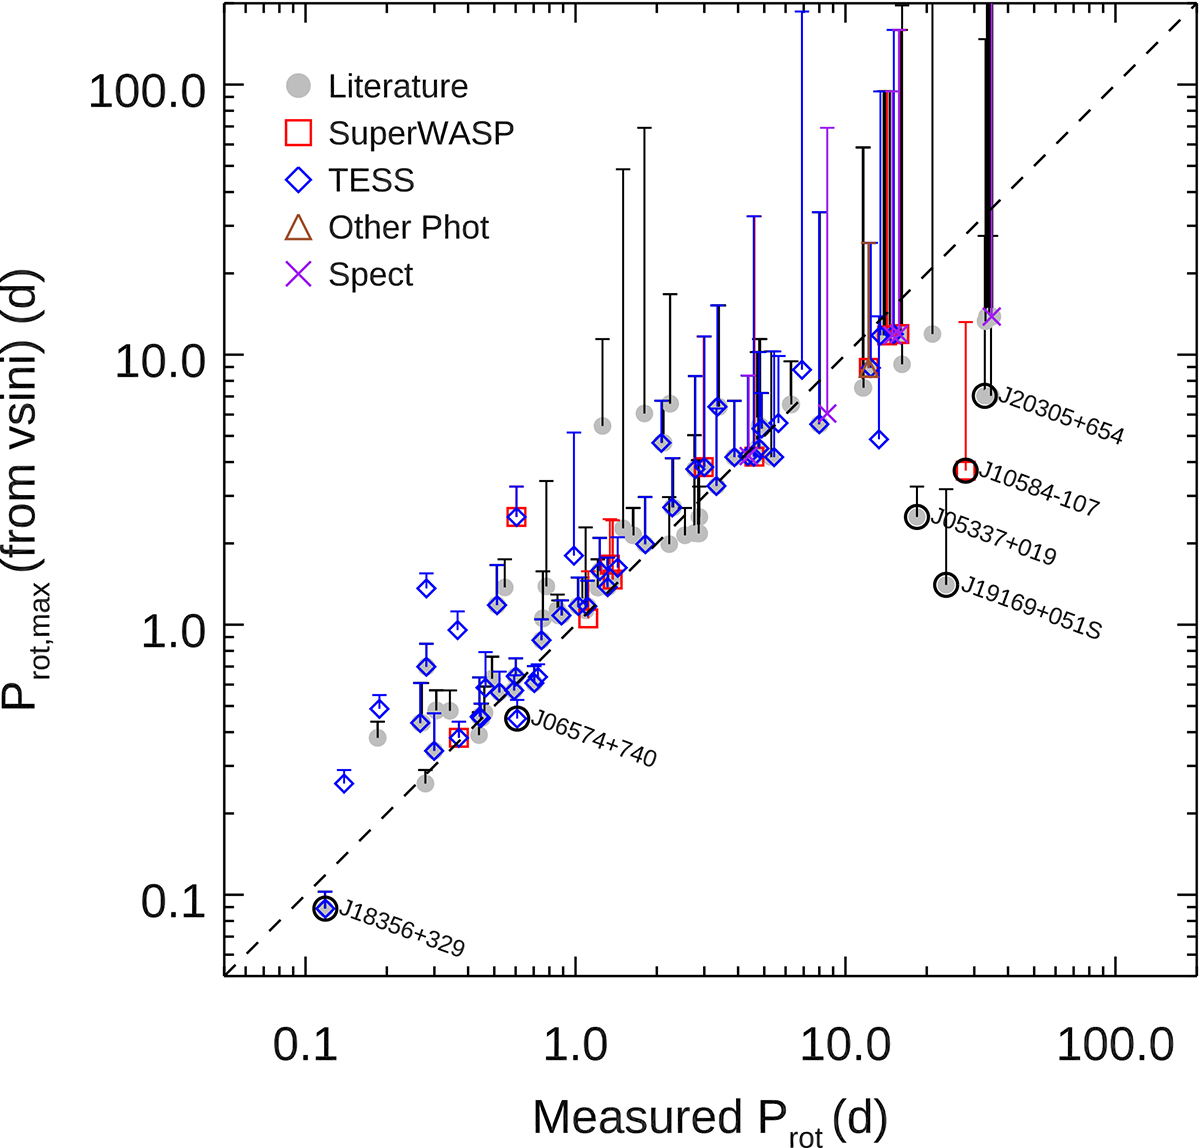
Comparison between measured Prot (from photometric or spectroscopic time series) and expected maximum Prot from v sin i and R⋆. Error bars mark the 1σ tolerance on Prot, max based on the uncertainties in v sin i and R⋆. Points falling in the region below the 1-to-1 line (dashed) have contradicting Prot, v sin i and R⋆ measurements. Those that fall significantly below (i.e., outside the 1σ error) are marked with a black circle and discussed in Appendix A.2.
Current usage metrics show cumulative count of Article Views (full-text article views including HTML views, PDF and ePub downloads, according to the available data) and Abstracts Views on Vision4Press platform.
Data correspond to usage on the plateform after 2015. The current usage metrics is available 48-96 hours after online publication and is updated daily on week days.
Initial download of the metrics may take a while.