Fig. C.4.
Download original image
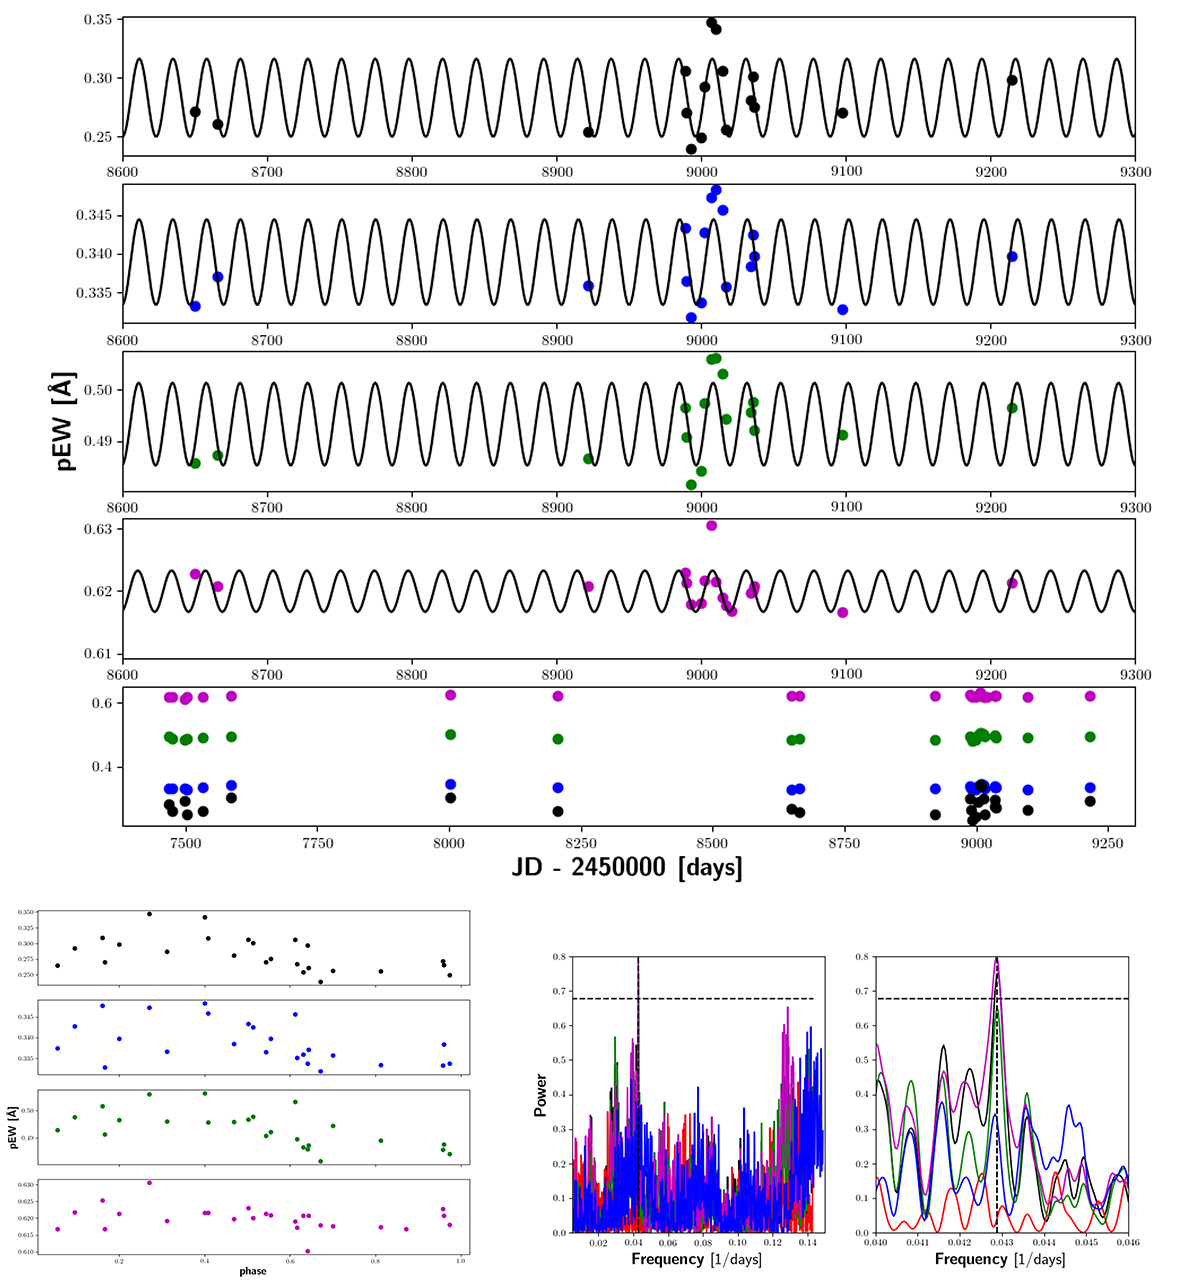
Example of spectroscopic indicator time series analysis for J14524+123. Top: time series data with sinusoids corresponding to the best-fitting period (23.3 d) overplotted; Middle: time series of the individual indicators over the entire baseline; Bottom left: phase-folded on the strongest period; Bottom right: GLS periodogram (middle) and zoom-in on the strongest period (right) of the 4 indicators, with horizontal dashed line denoting FAP = 0.1% and the peak highlighted by the vertical line. Black = Hα, blue = Ca-IRTa, green = Ca-IRTb, magenta = TiO. Red denotes the window function.
Current usage metrics show cumulative count of Article Views (full-text article views including HTML views, PDF and ePub downloads, according to the available data) and Abstracts Views on Vision4Press platform.
Data correspond to usage on the plateform after 2015. The current usage metrics is available 48-96 hours after online publication and is updated daily on week days.
Initial download of the metrics may take a while.