Open Access
Fig. 2.
Download original image
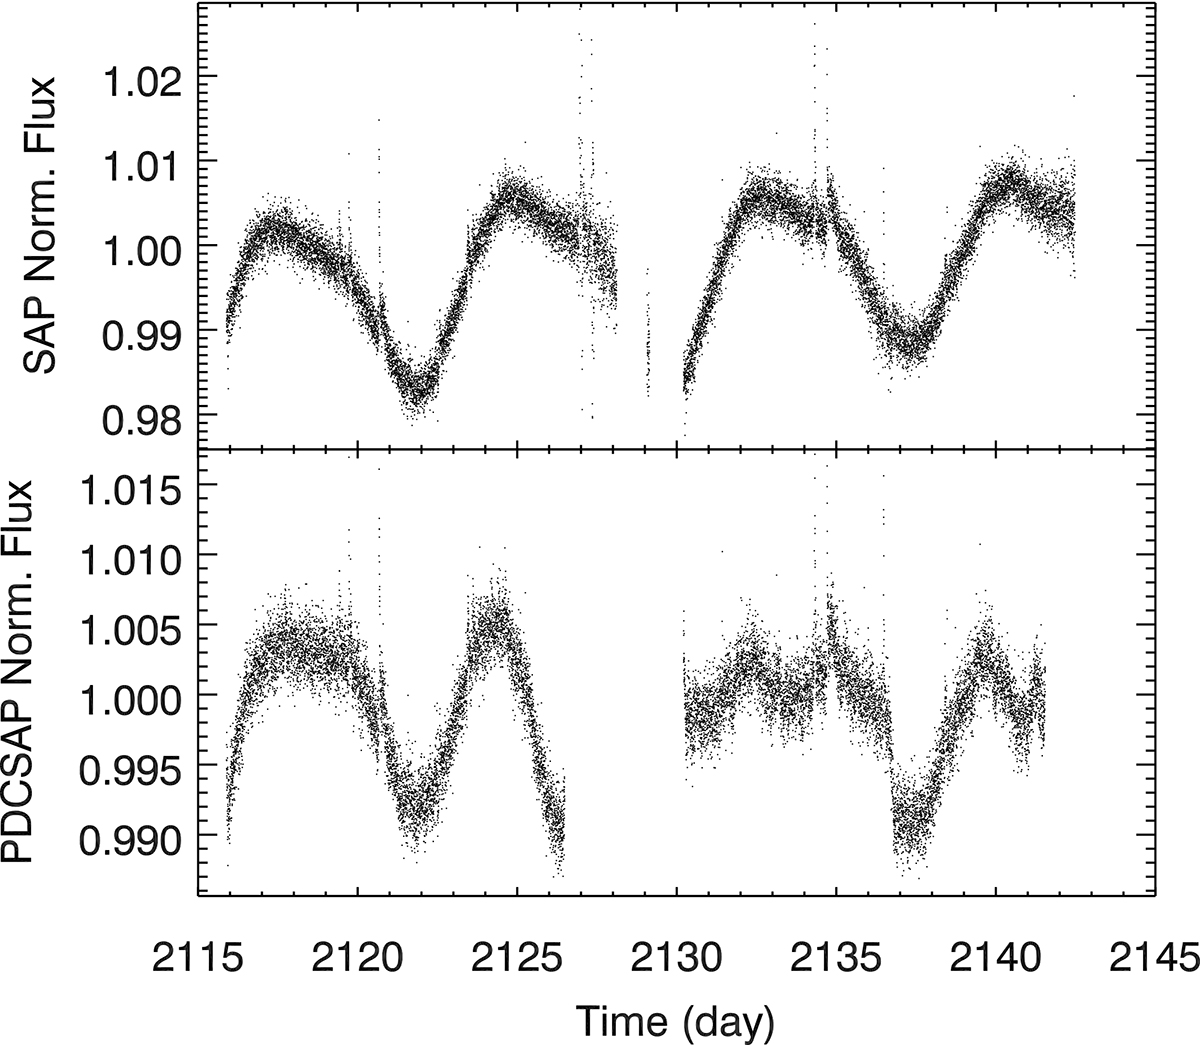
SAP (top) and PDCSAP (bottom) light curves for J01339−176 from TESS sector 30. A periodic modulation at ∼8 d is apparent in the SAP, but not in the PDCSAP. The time in the X axis is BJD – 2 457 000 days.
Current usage metrics show cumulative count of Article Views (full-text article views including HTML views, PDF and ePub downloads, according to the available data) and Abstracts Views on Vision4Press platform.
Data correspond to usage on the plateform after 2015. The current usage metrics is available 48-96 hours after online publication and is updated daily on week days.
Initial download of the metrics may take a while.