Open Access
Fig. C.2.
Download original image
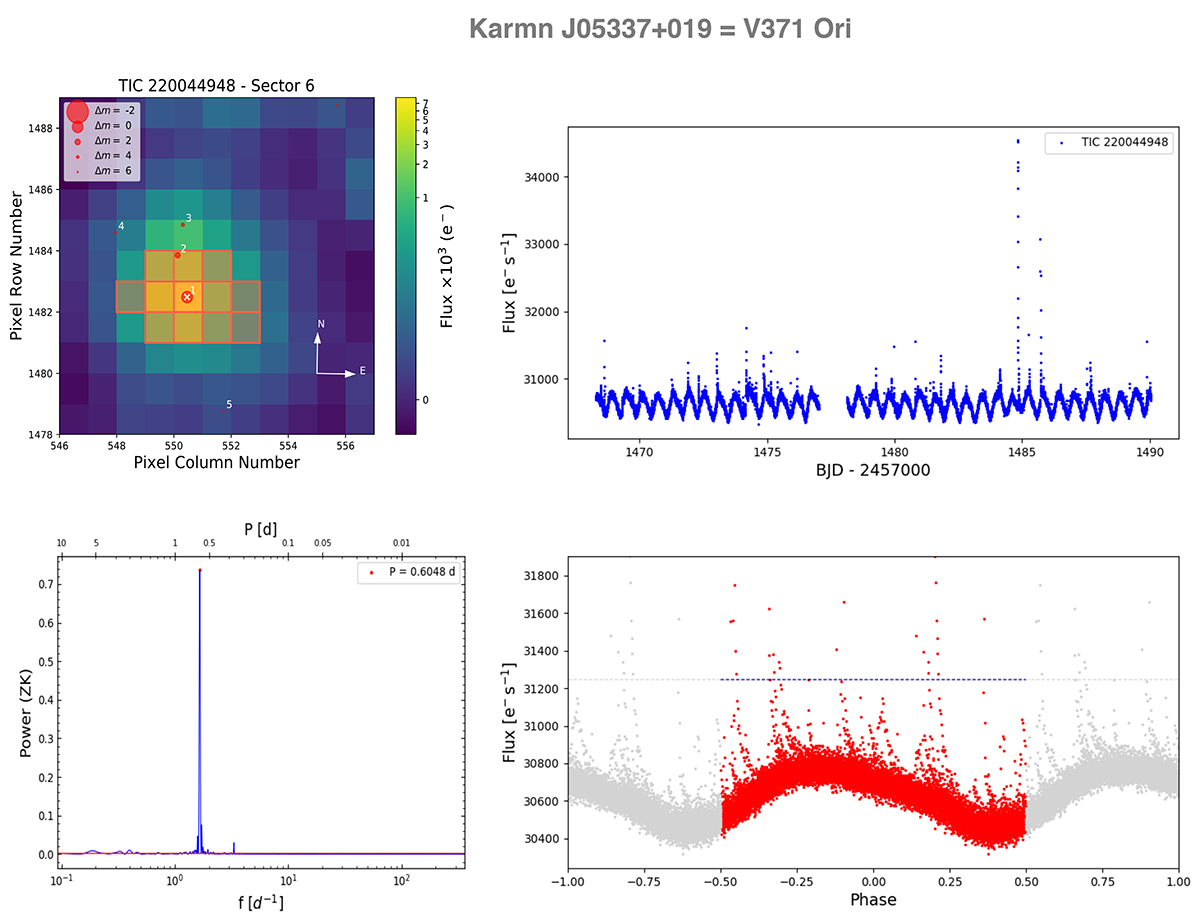
Summary page for the analysis of PDCSAP light curves from J05337+019, TESS sector 6. Top left: target pixel map; top right: PDCSAP light curve; bottom left: GLS periodogram; bottom right: light curve phase-folded on the peak period (0.6048 d).
Current usage metrics show cumulative count of Article Views (full-text article views including HTML views, PDF and ePub downloads, according to the available data) and Abstracts Views on Vision4Press platform.
Data correspond to usage on the plateform after 2015. The current usage metrics is available 48-96 hours after online publication and is updated daily on week days.
Initial download of the metrics may take a while.