Fig. 7
Download original image
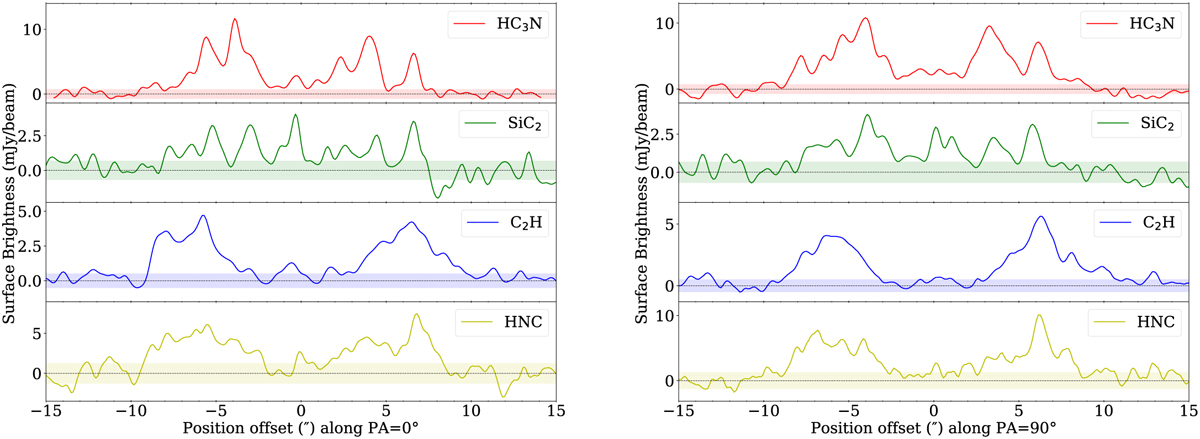
Brightness distributions of HC3N, SiC2, C2H, and HNC, in a3.3 km s−1 wide channel centred on the systemic velocity of IRAS 15194–5115, along a line that intersects the star at PA = 0° (left) and PA = 90° (right). These profiles were extracted from radial cuts using the stacked images shown in Fig. 6. The horizontal shaded region of each profile shows the rms noise of the corresponding emission map.
Current usage metrics show cumulative count of Article Views (full-text article views including HTML views, PDF and ePub downloads, according to the available data) and Abstracts Views on Vision4Press platform.
Data correspond to usage on the plateform after 2015. The current usage metrics is available 48-96 hours after online publication and is updated daily on week days.
Initial download of the metrics may take a while.