Fig. 6
Download original image
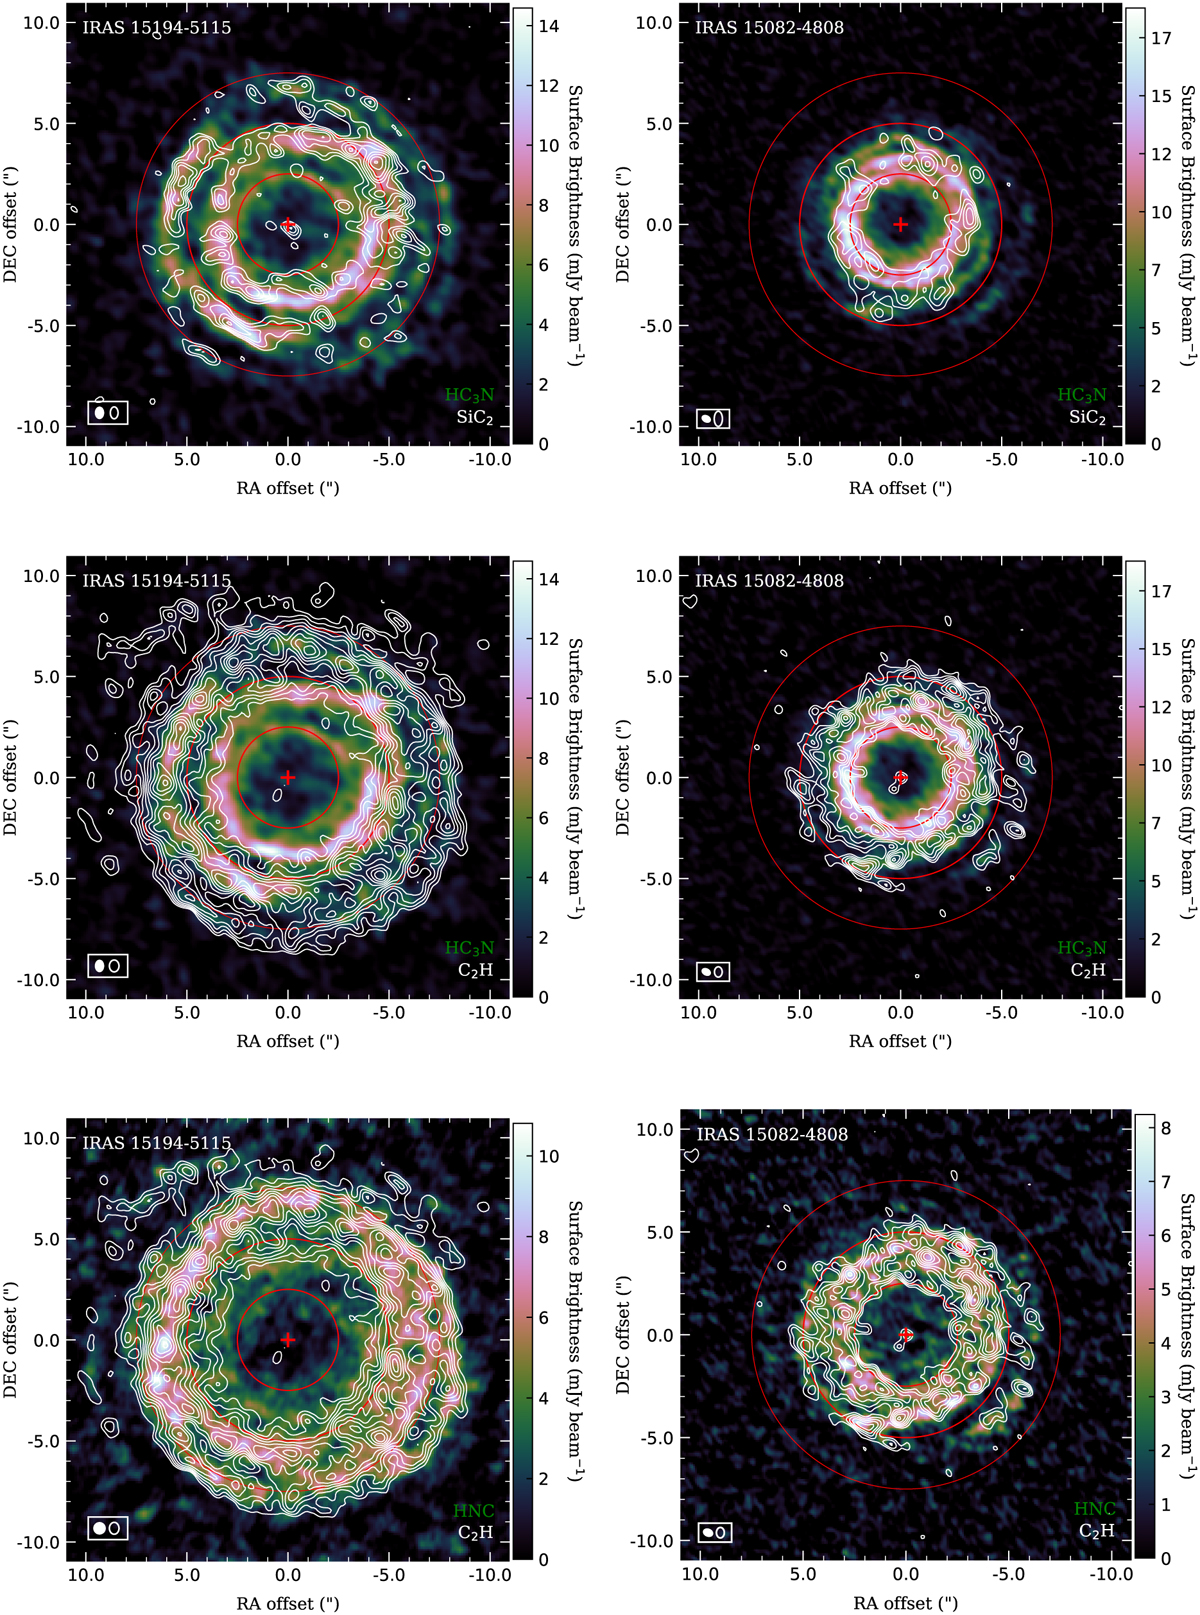
Average brightness distributions, in a 3.3 km s−1 wide channel centred on the systemic velocity, of selected molecules towards IRAS 15194–5115 (left panels) and IRAS 15082–4808 (right panels). The names of the species whose emissions are shown in colour and contours are given in the bottom right corner of each panel in green and white, respectively. The synthesised beams of the colour maps and contours are shown as filled and hollow ellipses, respectively, in the bottom left corner of each panel. Contours are from 3σ to 15σ in intervals of 1σ. The σ values of the contour maps are, for IRAS 15194–5115, SiC2: 0.68 mJy beam−1 and C2H: 0.50 mJy beam−1, and, for IRAS 15082–4808, SiC2: 1.1 mJy beam−1 and C2H: 0.31 mJy beam−1. The red + denotes the stellar position (continuum peak). Red circles of radius 2.″5, 5.″0 and 7.″5 are drawn on each map to facilitate comparisons.
Current usage metrics show cumulative count of Article Views (full-text article views including HTML views, PDF and ePub downloads, according to the available data) and Abstracts Views on Vision4Press platform.
Data correspond to usage on the plateform after 2015. The current usage metrics is available 48-96 hours after online publication and is updated daily on week days.
Initial download of the metrics may take a while.