Fig. 4
Download original image
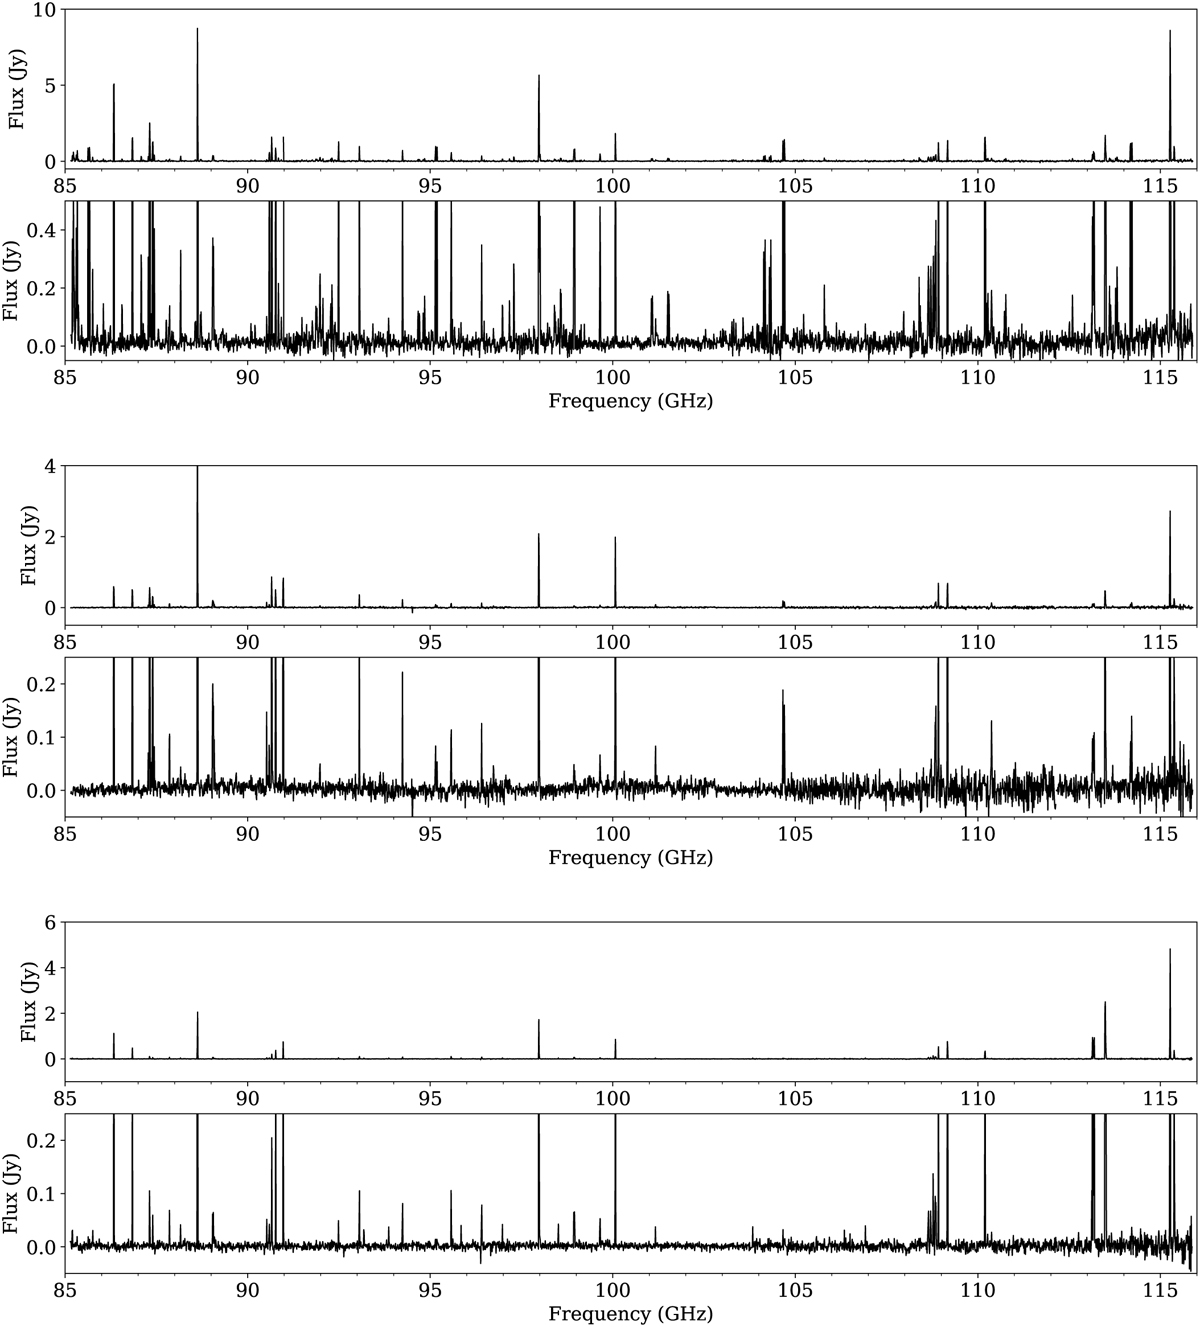
ALMA Band 3 spectra extracted using a 12.″5 radius aperture centred on the star, for IRAS 15194−5115 (top), IRAS 15082−4808 (middle), and IRAS 07454−7112 (bottom). The spectrum in the lower panel for each star is capped at a low flux density limit to reveal the weaker emission lines.
Current usage metrics show cumulative count of Article Views (full-text article views including HTML views, PDF and ePub downloads, according to the available data) and Abstracts Views on Vision4Press platform.
Data correspond to usage on the plateform after 2015. The current usage metrics is available 48-96 hours after online publication and is updated daily on week days.
Initial download of the metrics may take a while.