Fig. E.1
Download original image
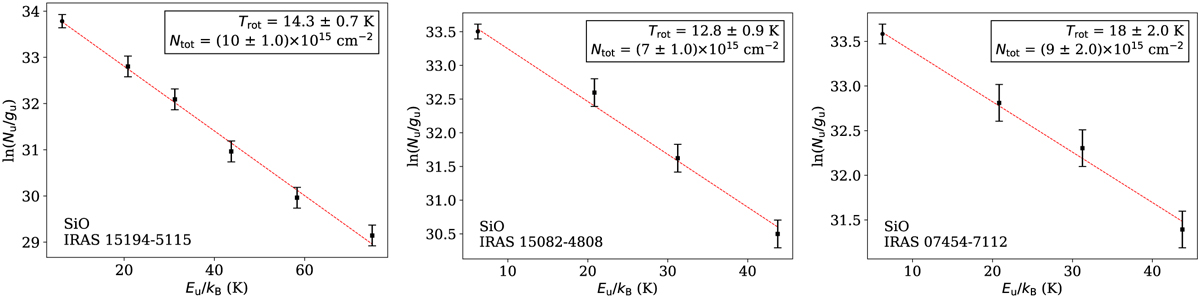
Population diagrams for SiO for the three stars, IRAS 15194–5115 (left), IRAS 15082–4808 (centre), and IRAS 07454–7112 (right). The solid line (red) is the best-fit linear model to the data (black). Rotation temperatures, Trot, and source-averaged column densities, Ntot, are listed in the legends. Circle and square points denote lines observed with ALMA and APEX, respectively. Hollow circles denote lines for which data combination (see Sect. 3.3) was performed.
Current usage metrics show cumulative count of Article Views (full-text article views including HTML views, PDF and ePub downloads, according to the available data) and Abstracts Views on Vision4Press platform.
Data correspond to usage on the plateform after 2015. The current usage metrics is available 48-96 hours after online publication and is updated daily on week days.
Initial download of the metrics may take a while.