Fig. C.108
Download original image
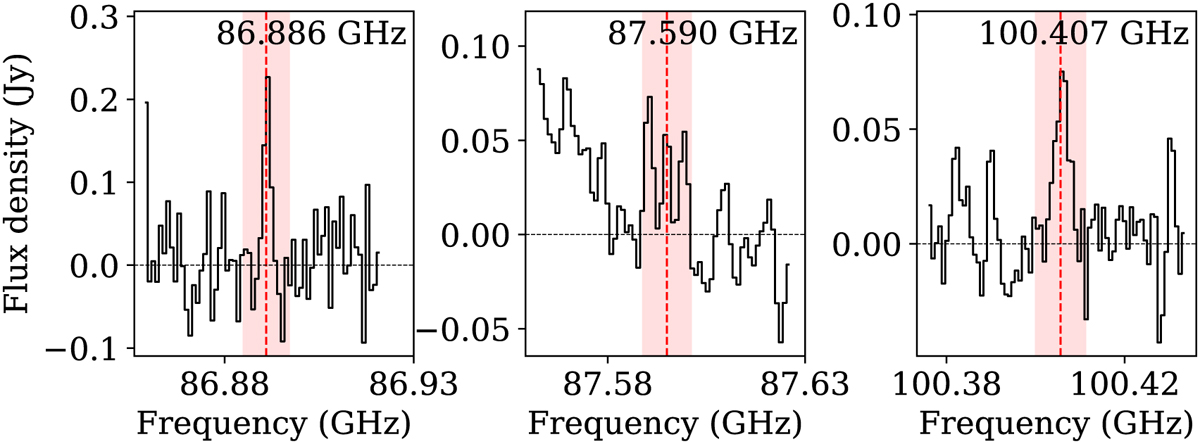
Spectra of unidentified lines towards IRAS 15194-5115. The width of the region shaded in pink is twice the expansion velocity of the source CSE. The feature to the left of the 87.59 GHz line is a blend of the 30SiS 5−4 and SiN 2−1 lines. The u-lines are too weak to show any structure in the emission maps. They are not detected in the other two sources.
Current usage metrics show cumulative count of Article Views (full-text article views including HTML views, PDF and ePub downloads, according to the available data) and Abstracts Views on Vision4Press platform.
Data correspond to usage on the plateform after 2015. The current usage metrics is available 48-96 hours after online publication and is updated daily on week days.
Initial download of the metrics may take a while.