Fig. 10
Download original image
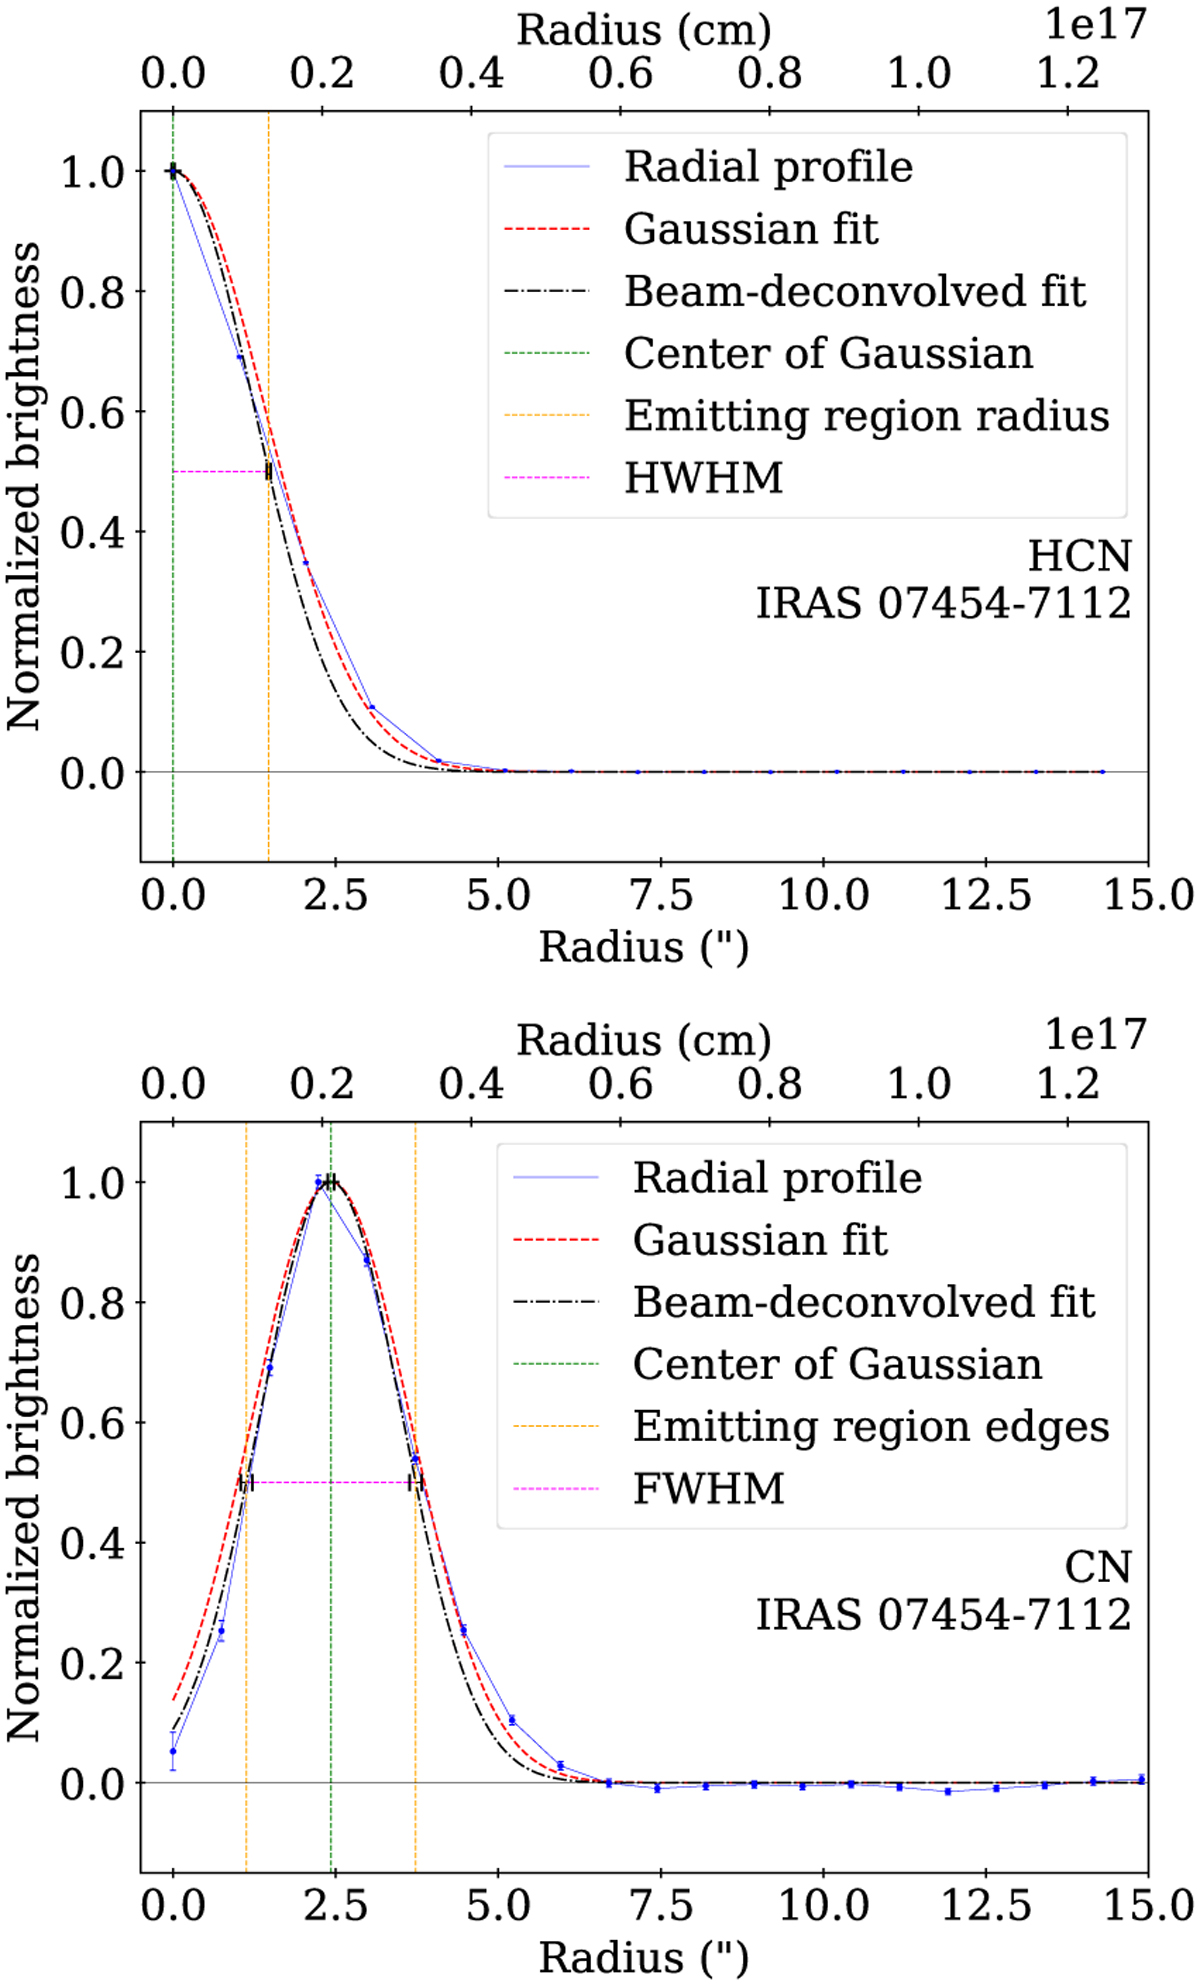
Examples of Gaussian fits to the AARPs: HCN (centrally peaked species, top panel) and CN (shell species, bottom panel), both towards IRAS 07454–7112. The solid blue lines show the mean AARPs and the dashed red lines show the Gaussian fits. The dash-dotted black Gaussians were obtained by deconvolving the beam from the Gaussian fit. The yellow lines show the HWHM distance from the centre of the beam-deconvolved Gaussian on either side of the peak, and the horizontal pink linse depicts the HWHM (for centrally peaked emission, top panel) or the FWHM (for shell emission, bottom panel) of the beam-deconvolved Gaussian.
Current usage metrics show cumulative count of Article Views (full-text article views including HTML views, PDF and ePub downloads, according to the available data) and Abstracts Views on Vision4Press platform.
Data correspond to usage on the plateform after 2015. The current usage metrics is available 48-96 hours after online publication and is updated daily on week days.
Initial download of the metrics may take a while.