Fig. 1
Download original image
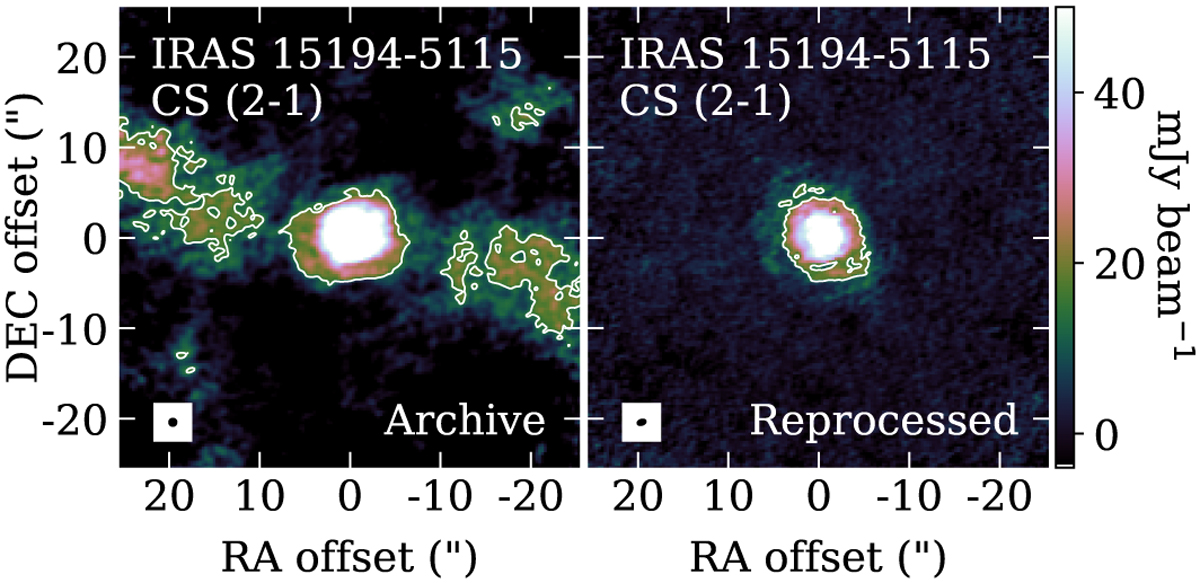
CS .J = 2−1 emission at 97.98 GHz towards IRAS 15194–5115, in a 3.3 km s−1 wide channel centred on the systemic velocity. Left: archival data. Right: reprocessed data. The emission shown has been capped at 50 mlybeam−1 to make the low-level extended artefacts clearly visible. The white contours are at 5 mly beam−1. Synthesised beams are shown as filled black ellipses in the bottom left corner of each panel.
Current usage metrics show cumulative count of Article Views (full-text article views including HTML views, PDF and ePub downloads, according to the available data) and Abstracts Views on Vision4Press platform.
Data correspond to usage on the plateform after 2015. The current usage metrics is available 48-96 hours after online publication and is updated daily on week days.
Initial download of the metrics may take a while.