Fig. 4.
Download original image
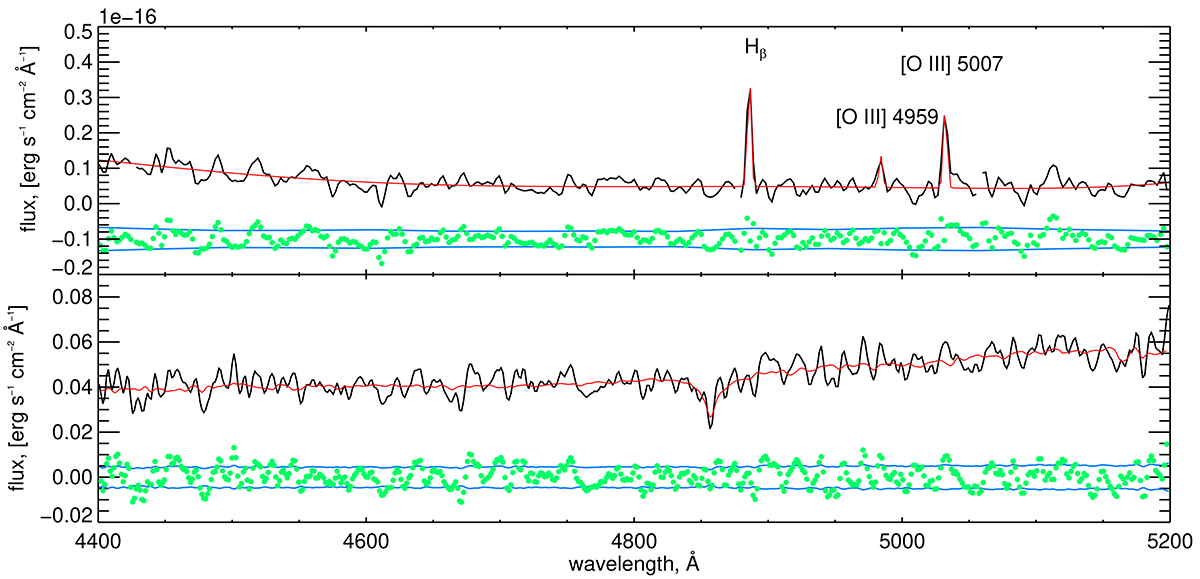
MEGARA spectroscopy of the NGC 7241 blue stream. Top panel: MEGARA LR-B spectrum of the northwest region showing line emission (see top right region of panel b in Fig. 2) fitted by a multi-Gaussian for emission lines with an additive polynomial for continuum. The Hβ line and the [O III]λλ4959, 5007 Å doublet are identified along with their positions for a redshift z = 0.00515. Bottom panel: spectrum of the compact source embedded in the stream fitted by the PEGASE.HR stellar population models using the NBURSTS program. The black line represents the smoothed spectrum of the object and the red line corresponds to the fit. The blue lines and green dots show the flux errors and the data residuals (shifted to −0.1 for the top panel).
Current usage metrics show cumulative count of Article Views (full-text article views including HTML views, PDF and ePub downloads, according to the available data) and Abstracts Views on Vision4Press platform.
Data correspond to usage on the plateform after 2015. The current usage metrics is available 48-96 hours after online publication and is updated daily on week days.
Initial download of the metrics may take a while.