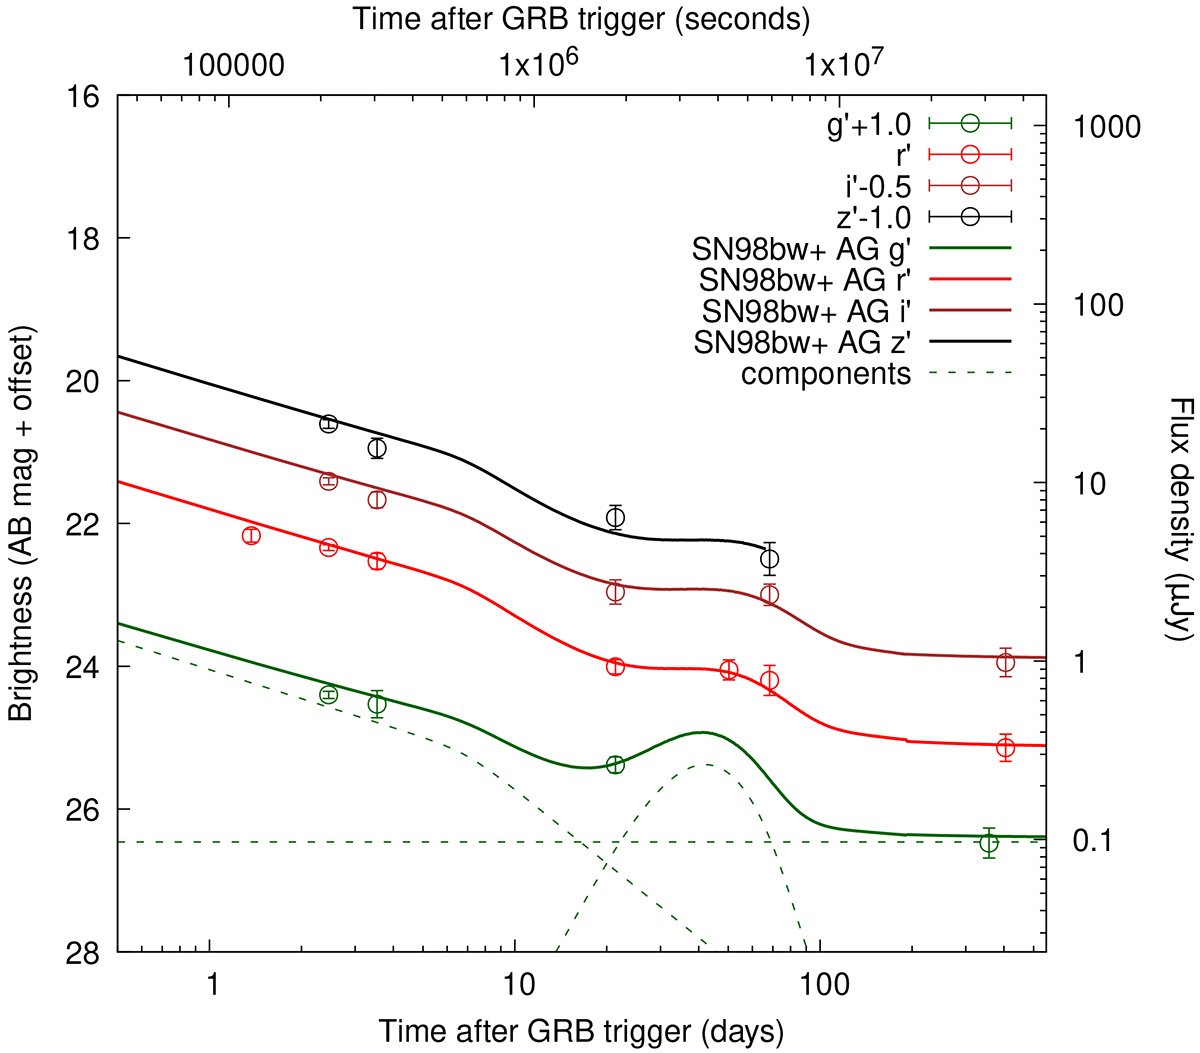
Fig. 3.
Download original image
Late g′r′i′z′ light curves of OT. For the g′ band, we also show its breakdown into afterglow, host-galaxy, and SN flux. Data are corrected for Galactic extinction, given in the AB magnitude system, and additionally offset by the values given in the legend, but they are not corrected for the extinction in the host, as in Fig. 1. For the SN component, we used the best-fit values provided in Table 1.
Current usage metrics show cumulative count of Article Views (full-text article views including HTML views, PDF and ePub downloads, according to the available data) and Abstracts Views on Vision4Press platform.
Data correspond to usage on the plateform after 2015. The current usage metrics is available 48-96 hours after online publication and is updated daily on week days.
Initial download of the metrics may take a while.