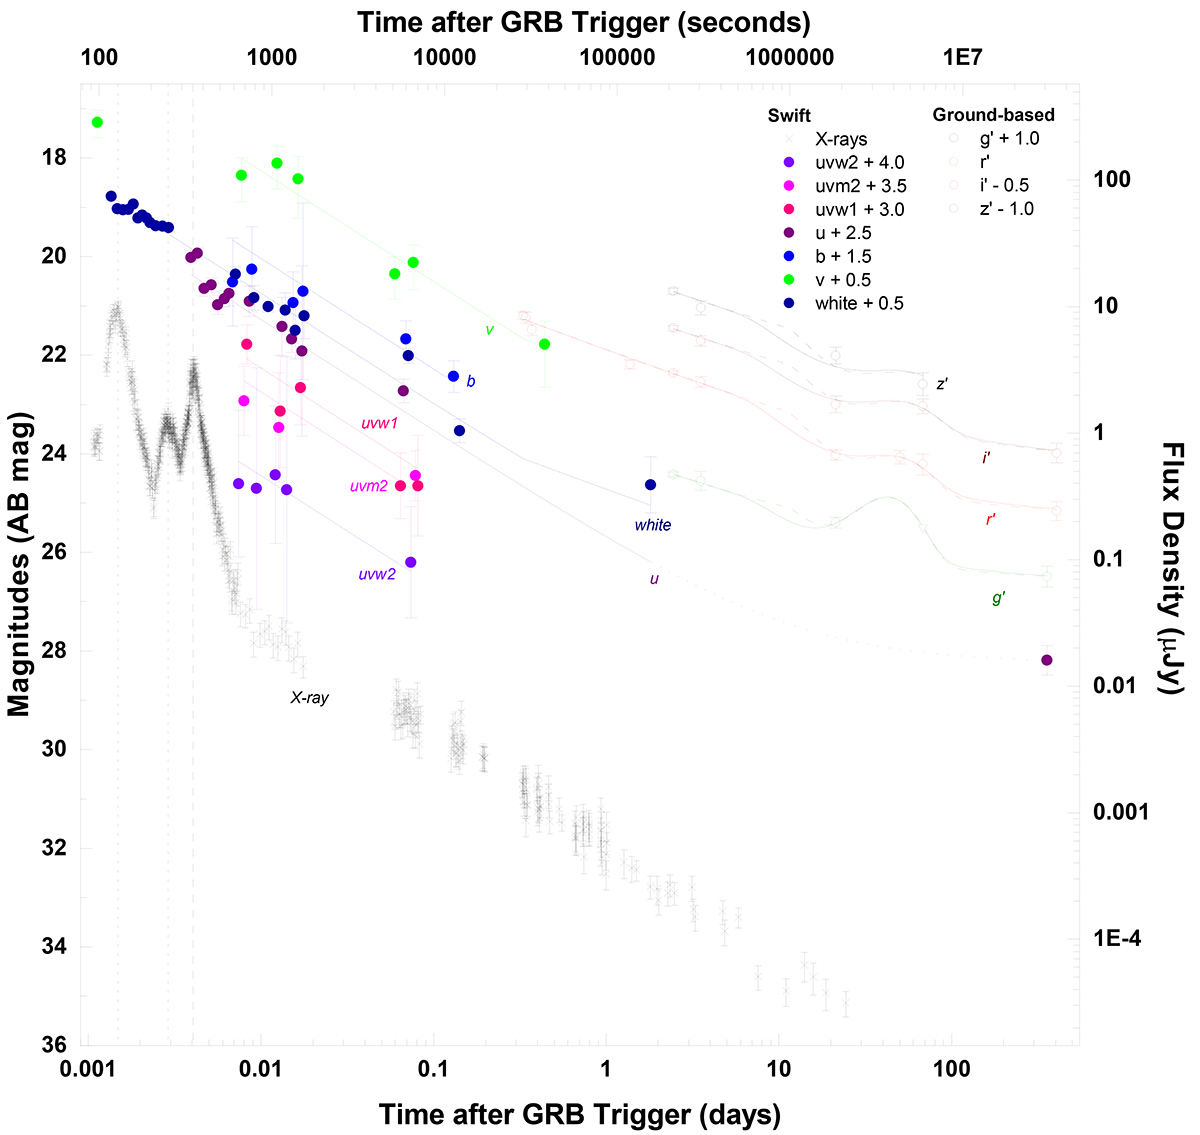
Fig. 1.
Download original image
Observations of optical transient that followed GRB 140506A. UVOT data (uvw2, uvm2, uvw1, u, b, v, white) are presented in this paper (Table A.1). Ground-based u′g′r′i′z′ magnitudes are from Fynbo et al. (2014) and Heintz et al. (2017). The downward-pointing triangle in g′ at 68 days is an upper limit. We do not show UVOT upper limits and JHKs data as they add no relevant information. Data are corrected for Galactic extinction, given in the AB magnitude system, and additionally offset by the values given in the legend to improve legibility. The flux density scale is only valid for the (unshifted) r′ band. The rest was shifted for clarity. The scale of the X-ray data was chosen arbitrarily. We show two possible fits with breaks at 7 (solid fit curve) and at 12 (dotted fit curve) days, which include both the afterglow and the SN/host contributions. Dotted vertical lines mark the peaks of two early X-ray flares that have no counterparts in the UV/optical range, whereas the flare marked by the dashed vertical line is also detected by UVOT. The flatter decay after 0.33 d in the late UVOT v and white light curves is simply the shifted r′-band fit (see text for more details).
Current usage metrics show cumulative count of Article Views (full-text article views including HTML views, PDF and ePub downloads, according to the available data) and Abstracts Views on Vision4Press platform.
Data correspond to usage on the plateform after 2015. The current usage metrics is available 48-96 hours after online publication and is updated daily on week days.
Initial download of the metrics may take a while.