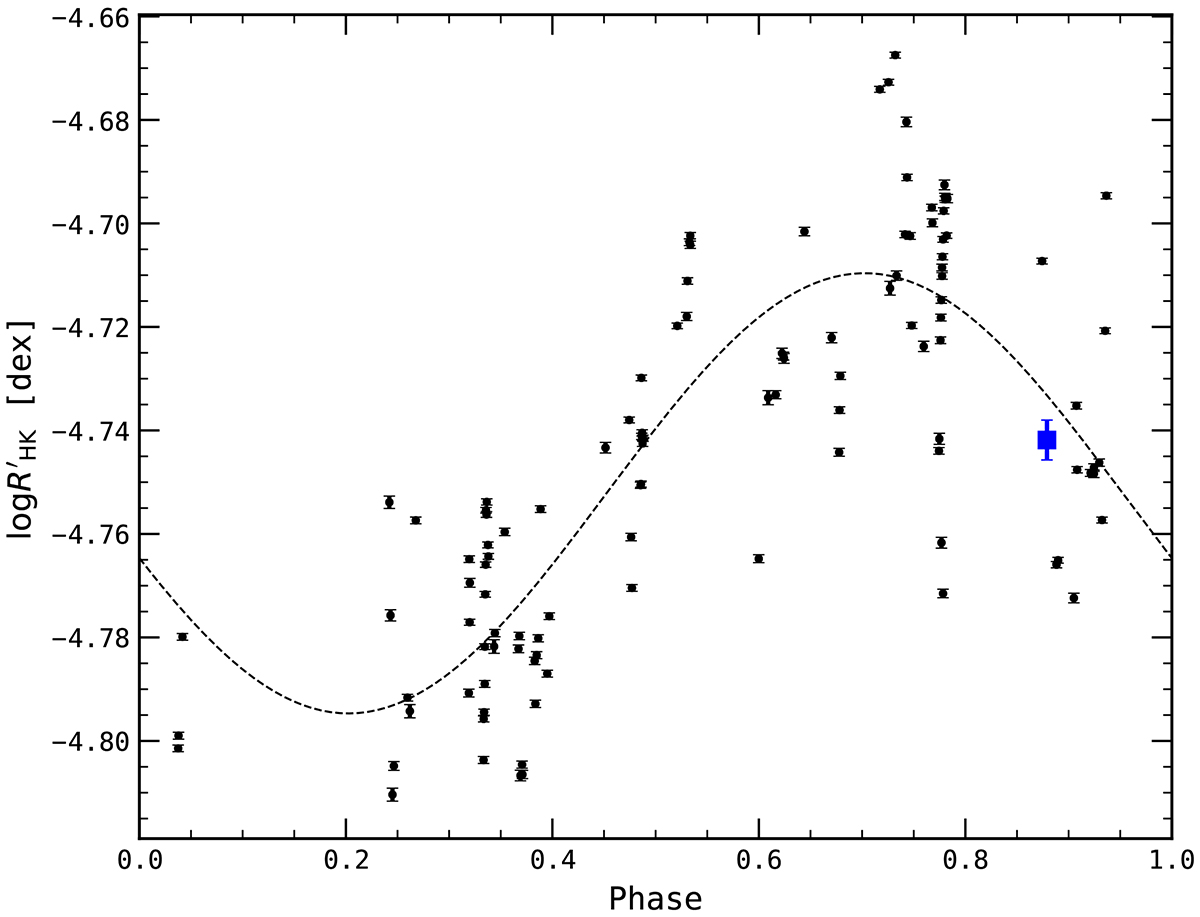
Fig. C.1.

Download original image
Activity cycle of ϵ Indi as traced by ![]() . The long-term variation of
. The long-term variation of ![]() is phase-folded onto the estimated cycle period of ∼2600 days and modelled assuming a simple sinusoidal behaviour (dashed curve). The black dots represent HARPS observations, while the blue square represents the single-epoch, mean ESPRESSO emission level. The error bar on the latter is given by the standard deviation of the observations over the ESPRESSO campaign.
is phase-folded onto the estimated cycle period of ∼2600 days and modelled assuming a simple sinusoidal behaviour (dashed curve). The black dots represent HARPS observations, while the blue square represents the single-epoch, mean ESPRESSO emission level. The error bar on the latter is given by the standard deviation of the observations over the ESPRESSO campaign.
Current usage metrics show cumulative count of Article Views (full-text article views including HTML views, PDF and ePub downloads, according to the available data) and Abstracts Views on Vision4Press platform.
Data correspond to usage on the plateform after 2015. The current usage metrics is available 48-96 hours after online publication and is updated daily on week days.
Initial download of the metrics may take a while.


