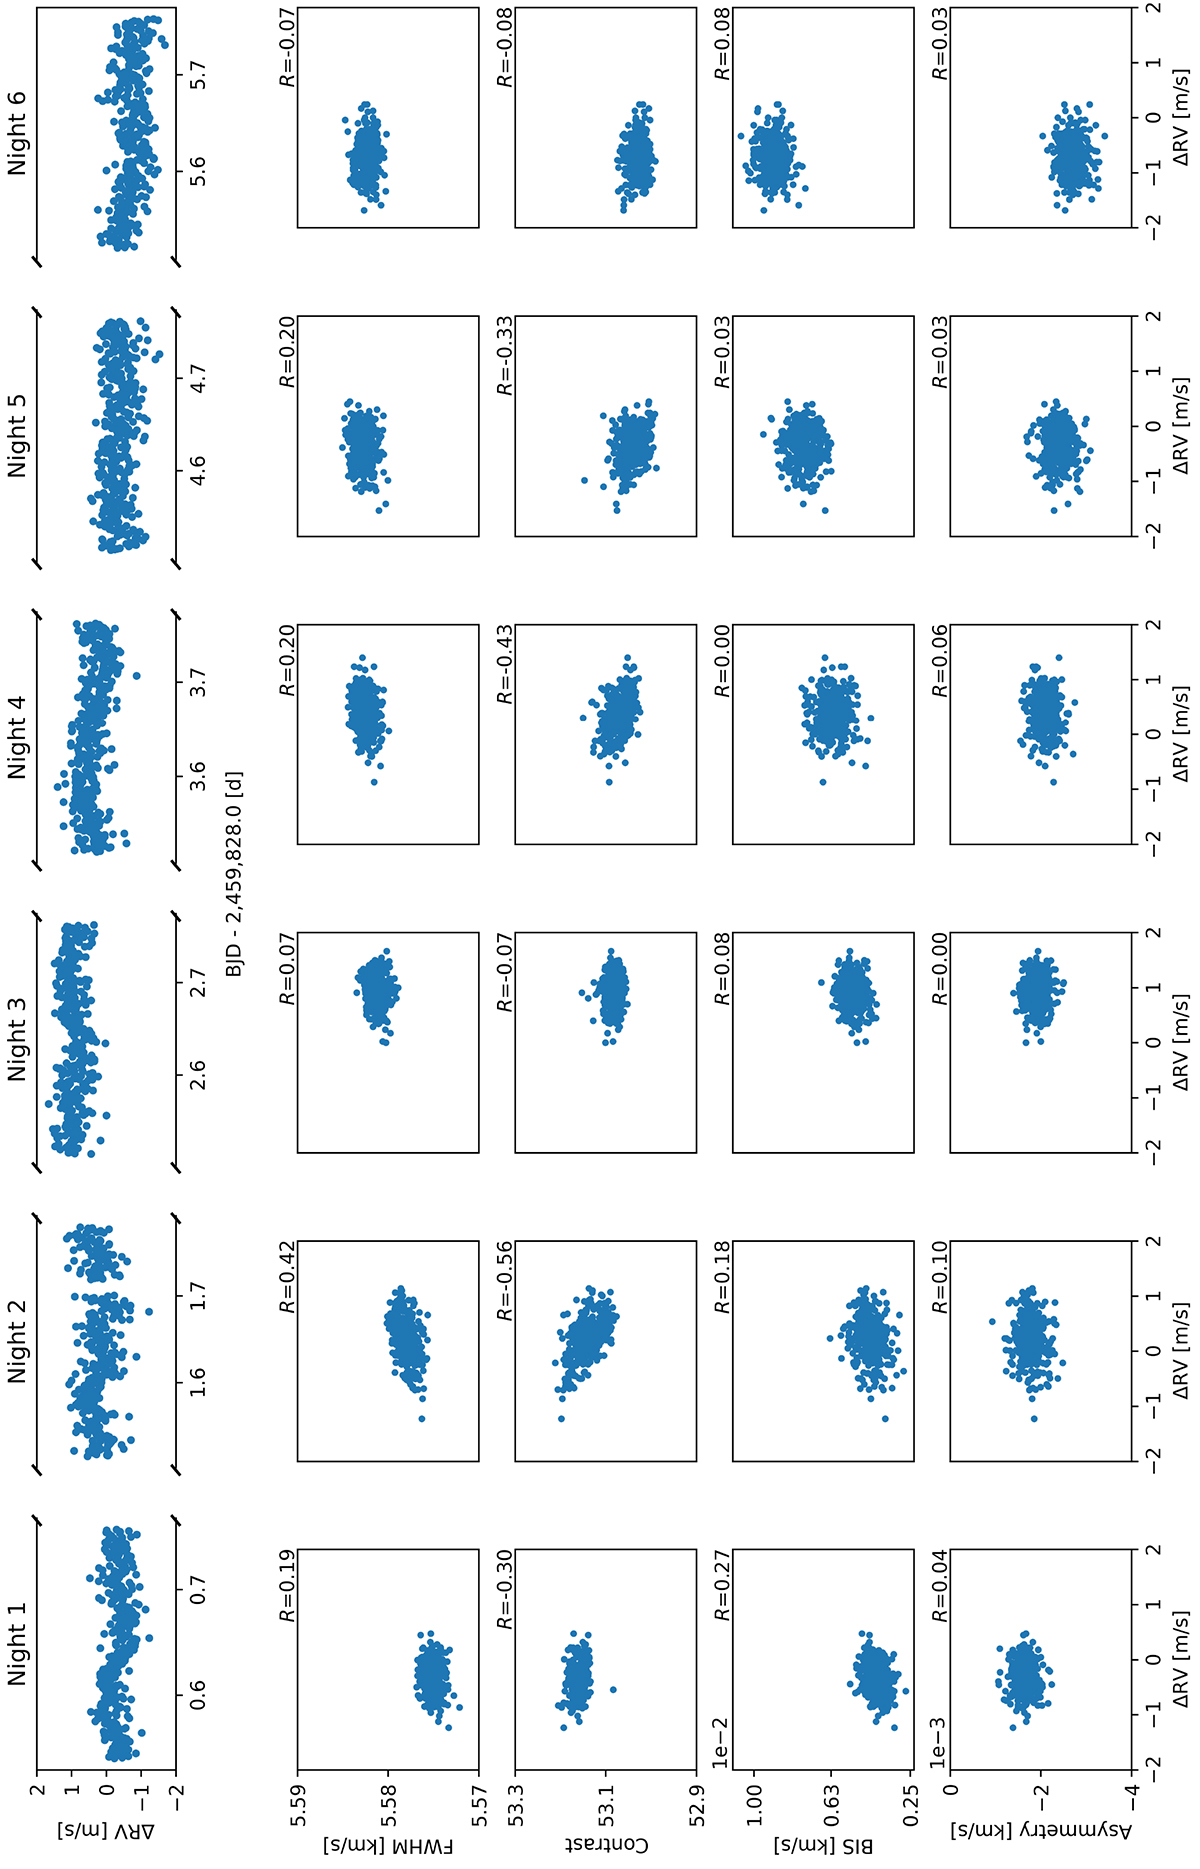
Fig. A.1.

Download original image
Derived radial velocities vs activity proxies. The raw time series (after removal of a constant RV offset) is shown in the leftmost column. A ∼20 min gap in the data collection is apparent toward the end of night 2, which resulted from an interruption of the corresponding observation block. The remaining columns show the relationship (on a nightly basis) between the RVs and associated CCF parameters (FWHM, contrast, BIS, and asymmetry). Each panel is supplemented by Pearson’s correlation coefficient, R.
Current usage metrics show cumulative count of Article Views (full-text article views including HTML views, PDF and ePub downloads, according to the available data) and Abstracts Views on Vision4Press platform.
Data correspond to usage on the plateform after 2015. The current usage metrics is available 48-96 hours after online publication and is updated daily on week days.
Initial download of the metrics may take a while.


