Fig. 3.

Download original image
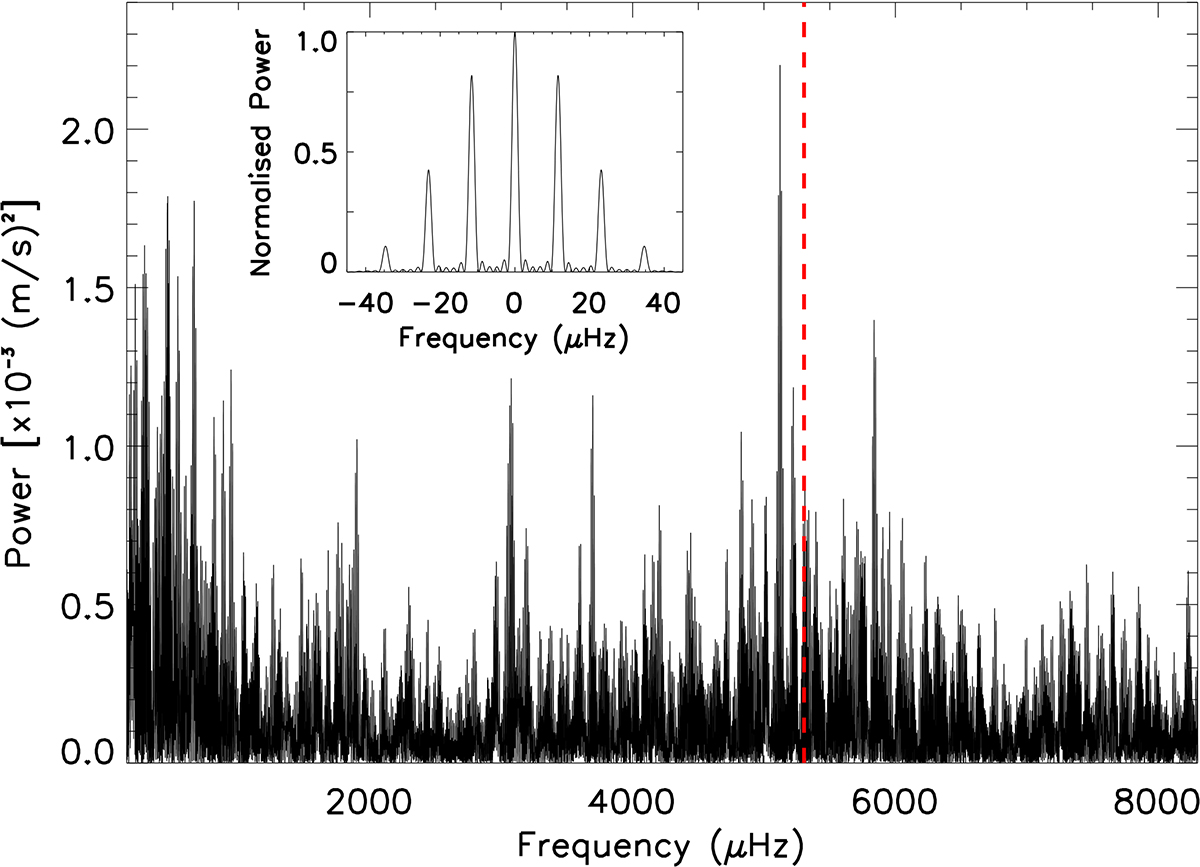
Noise-optimised power spectrum of ϵ Indi. The power spectrum has been oversampled for visual purposes. A clear power excess due to solar-like oscillations can be seen centred just above 5 mHz. The vertical dashed line represents the measured νmax (see text for details). The inset shows the spectral window, with prominent sidelobes (daily aliases) due to the single-site nature of the observations.
Current usage metrics show cumulative count of Article Views (full-text article views including HTML views, PDF and ePub downloads, according to the available data) and Abstracts Views on Vision4Press platform.
Data correspond to usage on the plateform after 2015. The current usage metrics is available 48-96 hours after online publication and is updated daily on week days.
Initial download of the metrics may take a while.


