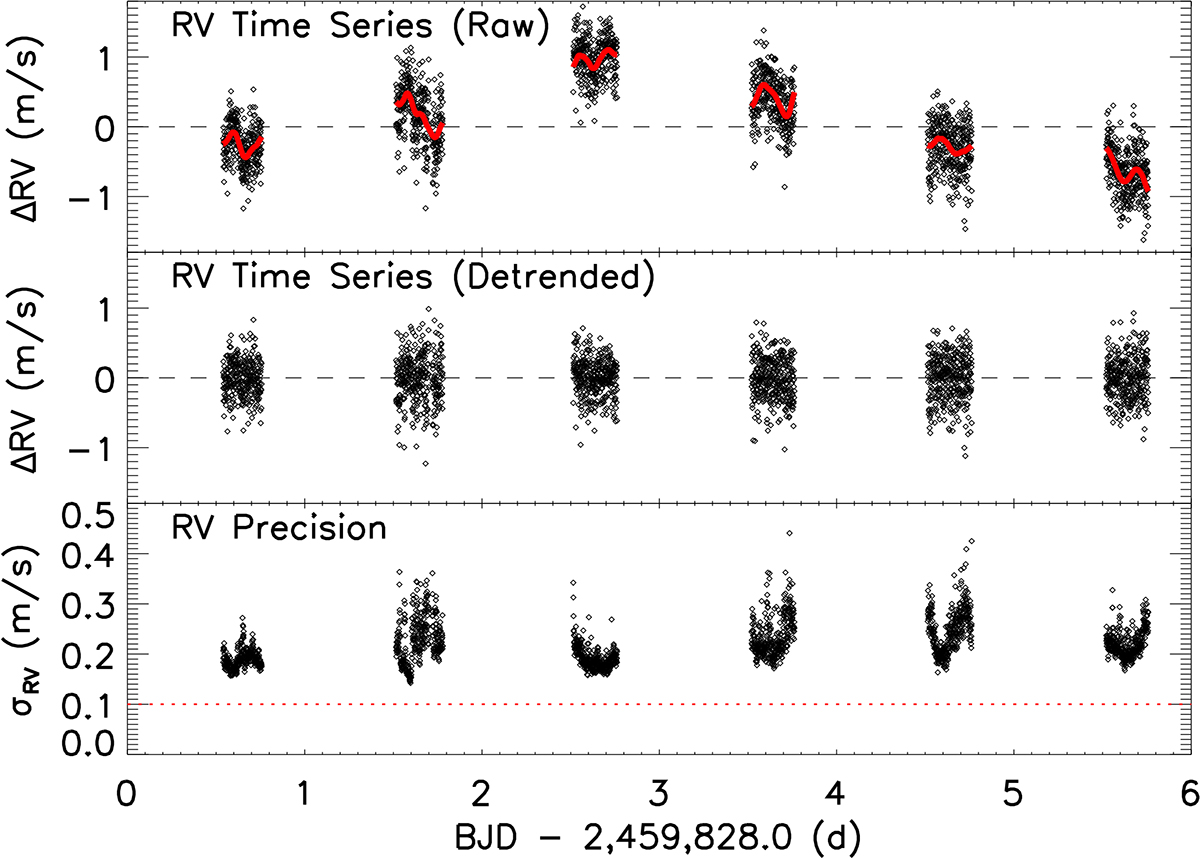
Fig. 2.

Download original image
Time series of ESPRESSO radial-velocity measurements of ϵ Indi. Top: raw time series (after removal of a constant RV offset). The solid red curves represent smoothing functions applied on a nightly basis (see text for details). Middle: detrended time series (after high-pass filtering). Bottom: internal (photon-noise limited) RV precision as returned by the ESPRESSO DRS. The horizontal dotted line represents the instrumental noise level of 10 cm s−1 quoted by Pepe et al. (2021).
Current usage metrics show cumulative count of Article Views (full-text article views including HTML views, PDF and ePub downloads, according to the available data) and Abstracts Views on Vision4Press platform.
Data correspond to usage on the plateform after 2015. The current usage metrics is available 48-96 hours after online publication and is updated daily on week days.
Initial download of the metrics may take a while.


