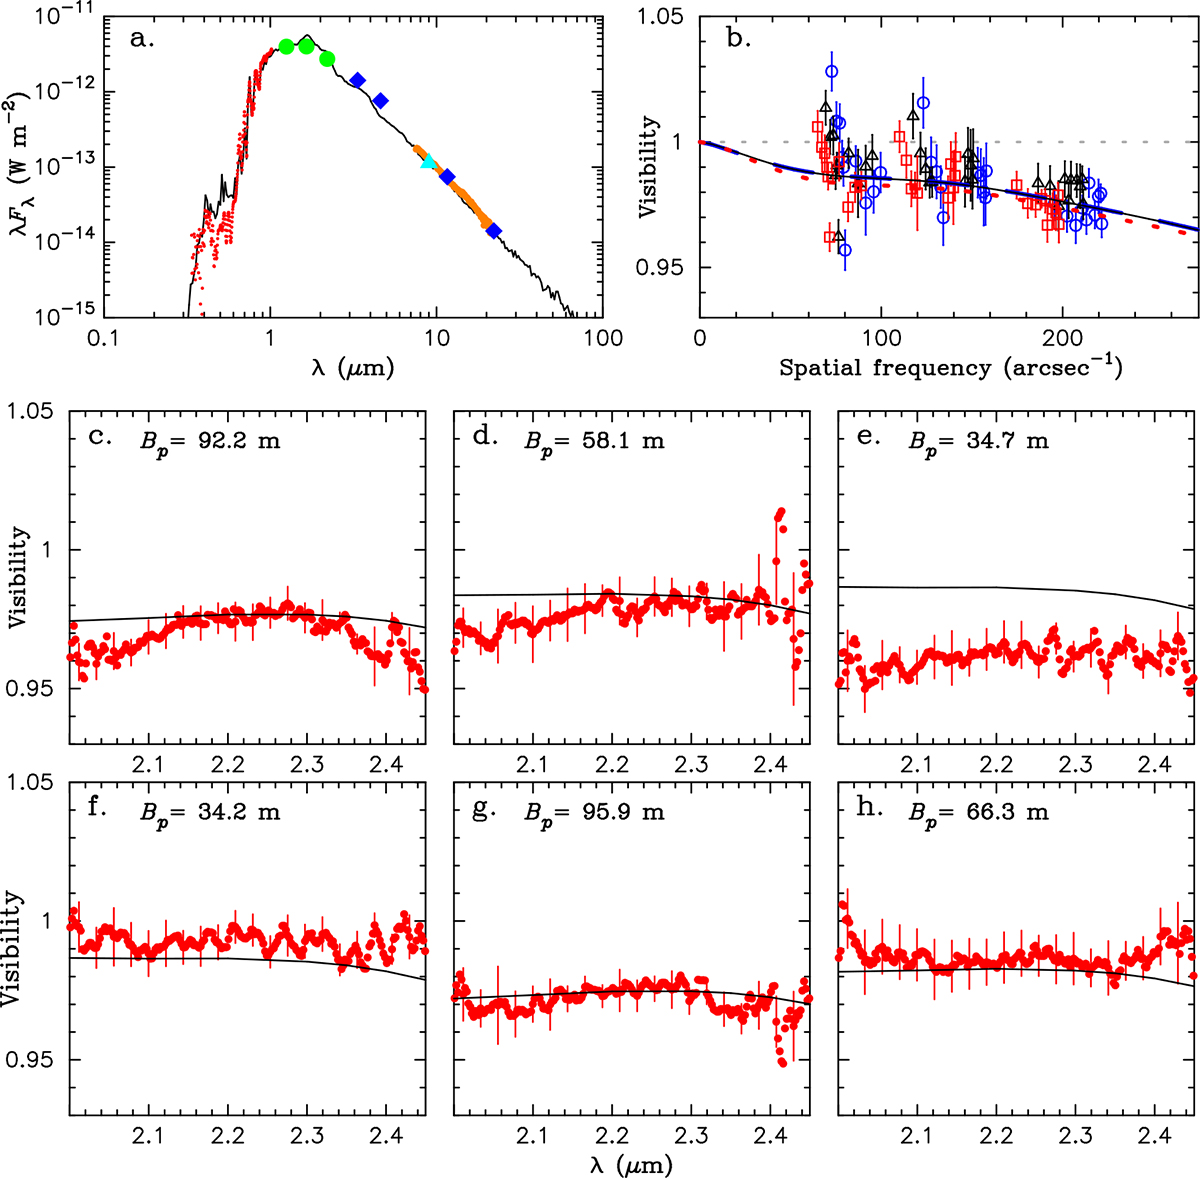
Fig. 2.
Download original image
Dust shell modeling of the SED and GRAVITY visibilities of 47 Tuc V3. Panel a: Comparison of the observed and model SEDs. The solid line represents the best-fiting model with τ0.55 = 0.15 and an inner boundary temperature of 700 K. The red dots, green circles, blue diamonds, light blue triangle, and thick orange line represent the Gaia spectrum, 2MASS JHKs photometric data, WISE photometric data, AKARI data, and Spitzer/IRS spectrum, respectively. Panel b: Comparison of the observed and model visibilities as a function of spatial frequency. The blue circles, black triangles, and red squares correspond to the visibilities measured at 2.1, 2.2, and 2.35 μm, respectively. The blue long-dashed line, black solid line (almost entirely overlapping with the long-dashed line), and red dotted line represent the model visibilities predicted at 2.1, 2.2, and 2.35 μm, respectively. The gray horizontal dotted line marks the visibility 1. Panels c–h: Comparison of the visibilities as a function of wavelength. In each panel, the red dots represent the observed data, while the black line represents the model.
Current usage metrics show cumulative count of Article Views (full-text article views including HTML views, PDF and ePub downloads, according to the available data) and Abstracts Views on Vision4Press platform.
Data correspond to usage on the plateform after 2015. The current usage metrics is available 48-96 hours after online publication and is updated daily on week days.
Initial download of the metrics may take a while.