Fig. 1.
Download original image
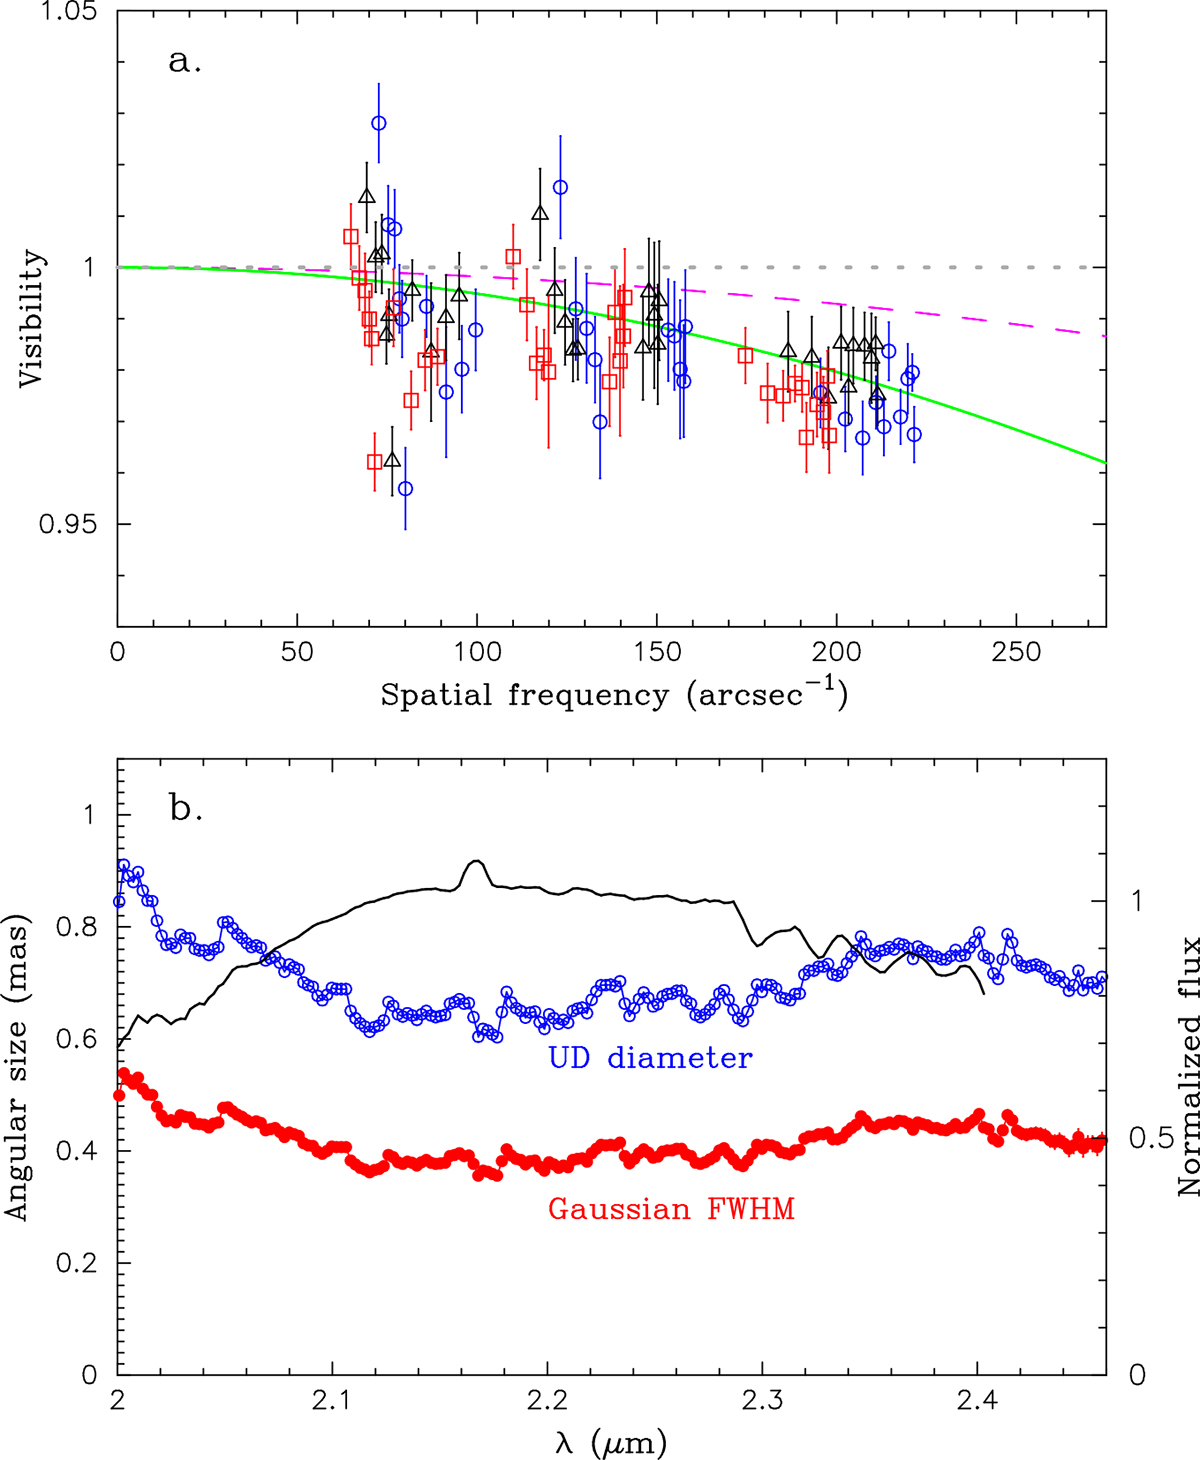
GRAVITY observations of the AGB star V3 in the metal-poor globular cluster 47 Tuc. Panel a: Visibilities observed at 2.1, 2.2, and 2.35 μm are plotted with the blue circles, black triangles, and red squares, respectively. The green solid line represents the visibility from the UD fit with an angular diameter of 0.65 mas derived at 2.2 μm, while the purple dashed line represents the uniform-disk visibility expected from the central star with a UD diameter of 0.38 mas. The gray horizontal dotted line marks the visibility 1. Panel b: Wavelength dependence of the FWHM and angular diameter obtained by the Gaussian fit and UD fit to the observed visibilities are shown by the red filled circles and blue open circles, respectively. The black solid line shows the normalized spectrum derived from the GRAVITY data. The peak seen at ∼2.165 μm is not real, but caused instead by the Br γ absorption line seen in the calibrator’s spectrum, which was not entirely removed by our spectroscopic calibration. The spectrum is cut off at ∼2.4 μm because the spectrum of the proxy star used in the spectroscopic calibration only extends to 2.42 μm.
Current usage metrics show cumulative count of Article Views (full-text article views including HTML views, PDF and ePub downloads, according to the available data) and Abstracts Views on Vision4Press platform.
Data correspond to usage on the plateform after 2015. The current usage metrics is available 48-96 hours after online publication and is updated daily on week days.
Initial download of the metrics may take a while.