Fig. E.1.
Download original image
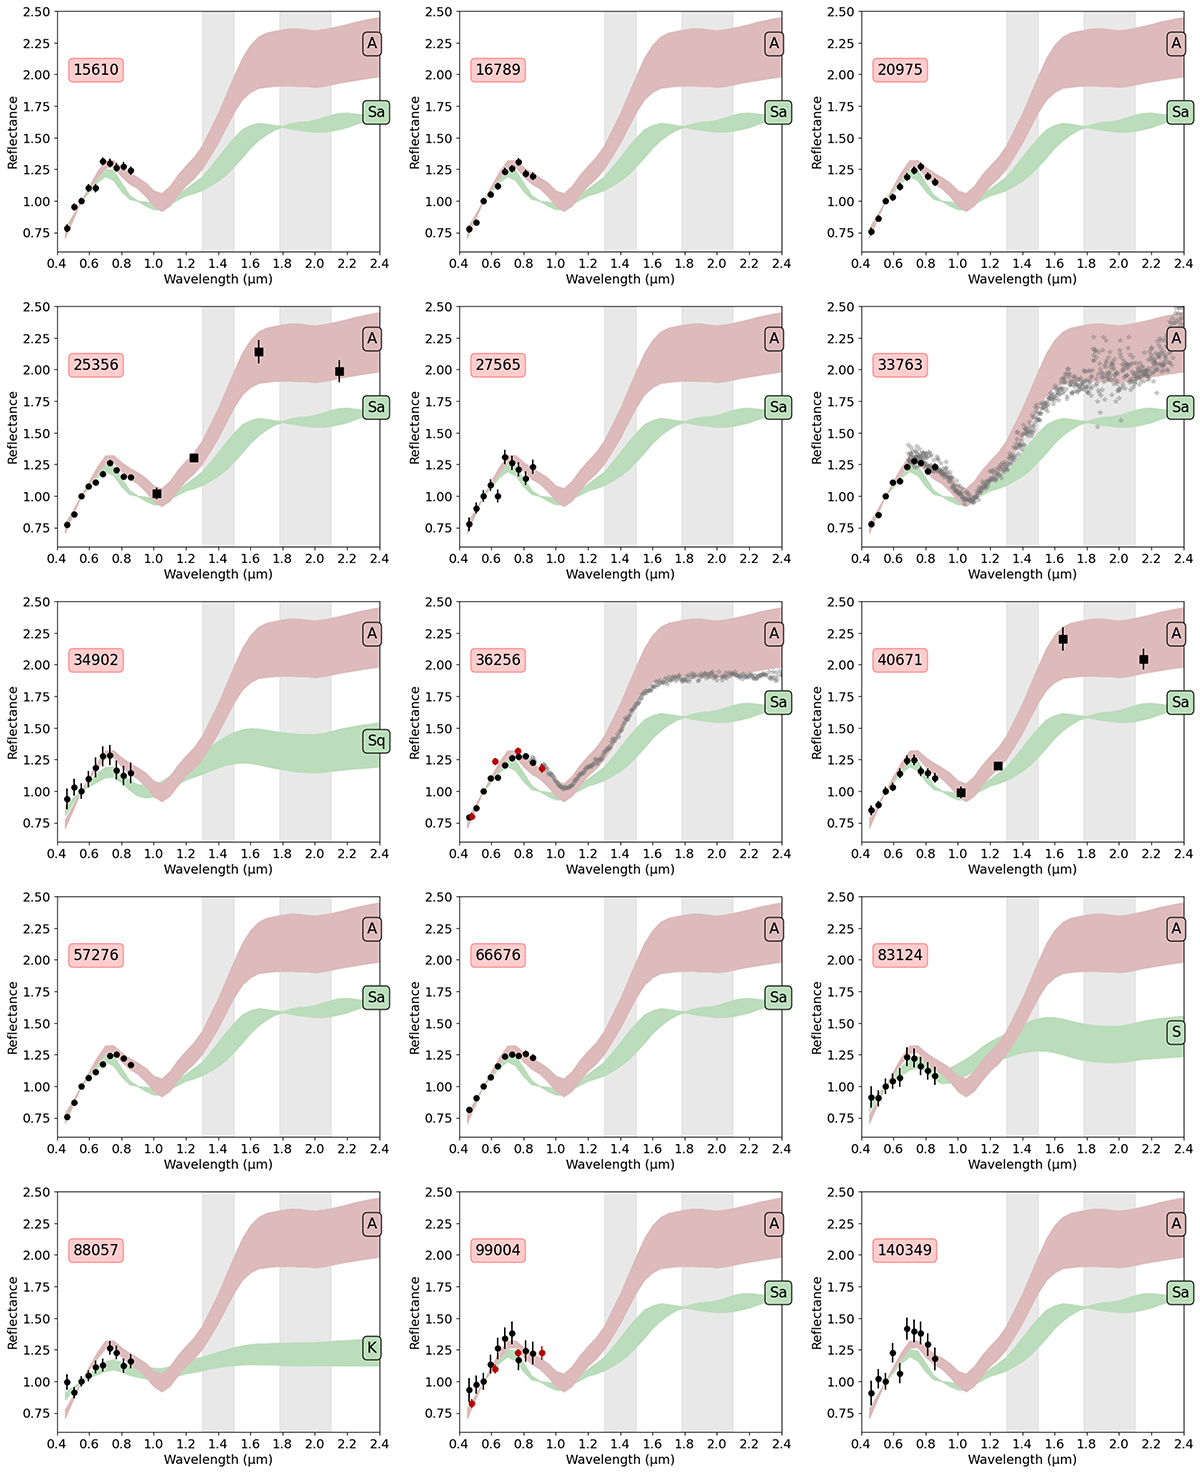
Available data of the members of the family (36256) 1999 XT17 in the Gaia DR3: Gaia spectra (black dots), SDSS data from DeMeo & Carry (2013) (red dots), MOVIS data from Popescu et al. (2018a) (black squares), and NIR spectra from DeMeo et al. (2019) (grey stars). The shaded coloured areas represent the reflectance spectra from the A-type and other classes templates of DeMeo et al. (2009).
Current usage metrics show cumulative count of Article Views (full-text article views including HTML views, PDF and ePub downloads, according to the available data) and Abstracts Views on Vision4Press platform.
Data correspond to usage on the plateform after 2015. The current usage metrics is available 48-96 hours after online publication and is updated daily on week days.
Initial download of the metrics may take a while.