Open Access
Fig. A.2
Download original image
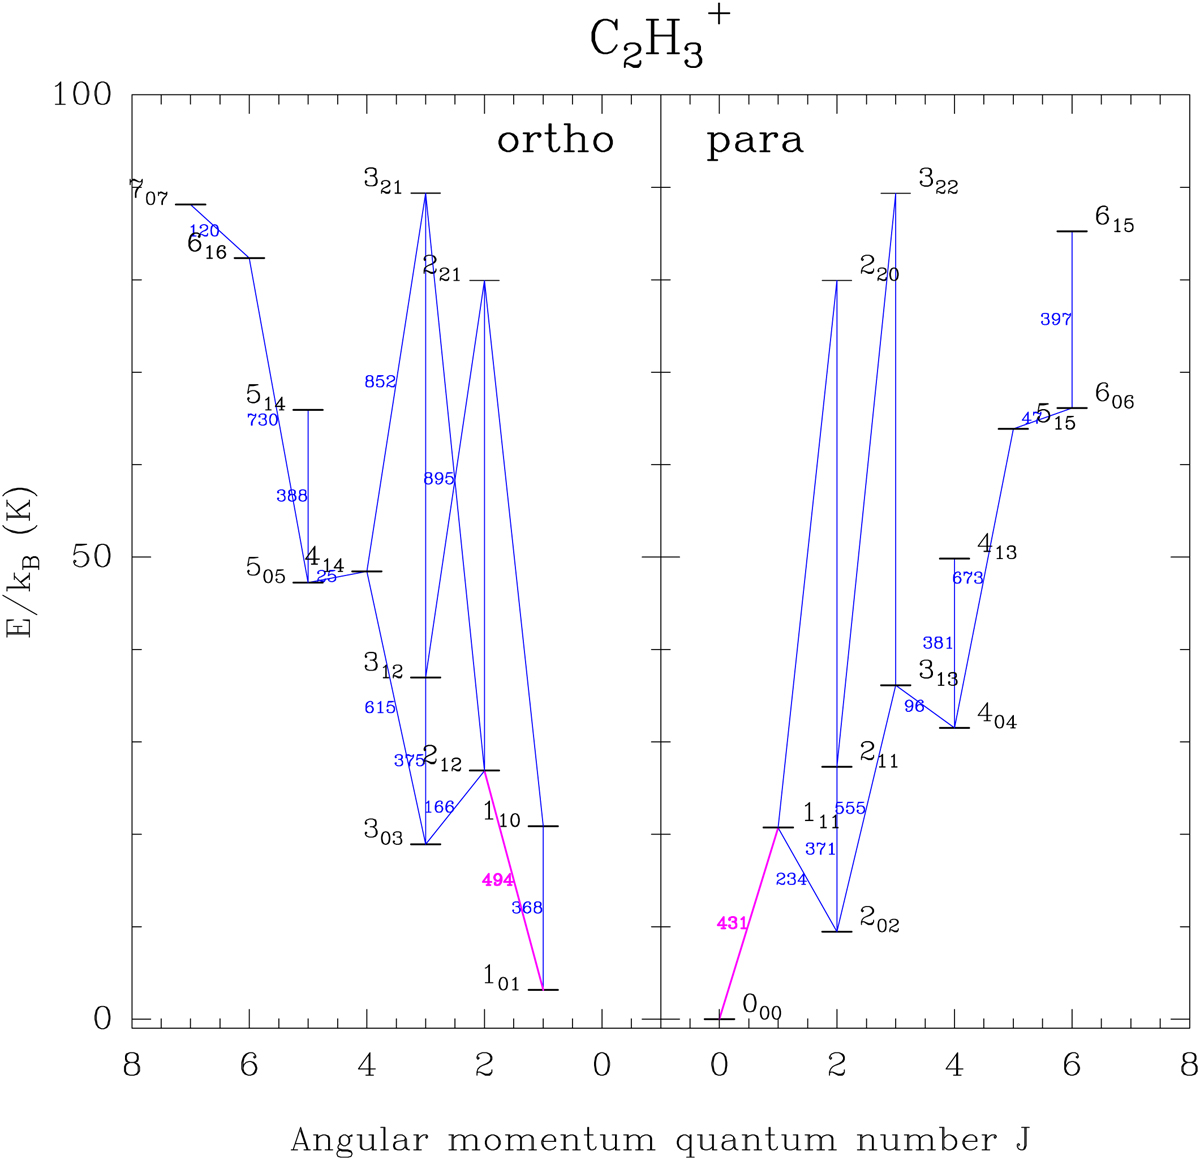
Diagram of the energy levels of ![]() for levels below 100 K. The labels correspond to the
for levels below 100 K. The labels correspond to the ![]() quantum numbers. The blue lines indicate the allowed rotational transitions, with frequencies given (in GHz), if below 1 THz. The lines observed in this work are shown in magenta.
quantum numbers. The blue lines indicate the allowed rotational transitions, with frequencies given (in GHz), if below 1 THz. The lines observed in this work are shown in magenta.
Current usage metrics show cumulative count of Article Views (full-text article views including HTML views, PDF and ePub downloads, according to the available data) and Abstracts Views on Vision4Press platform.
Data correspond to usage on the plateform after 2015. The current usage metrics is available 48-96 hours after online publication and is updated daily on week days.
Initial download of the metrics may take a while.