Fig. 6
Download original image
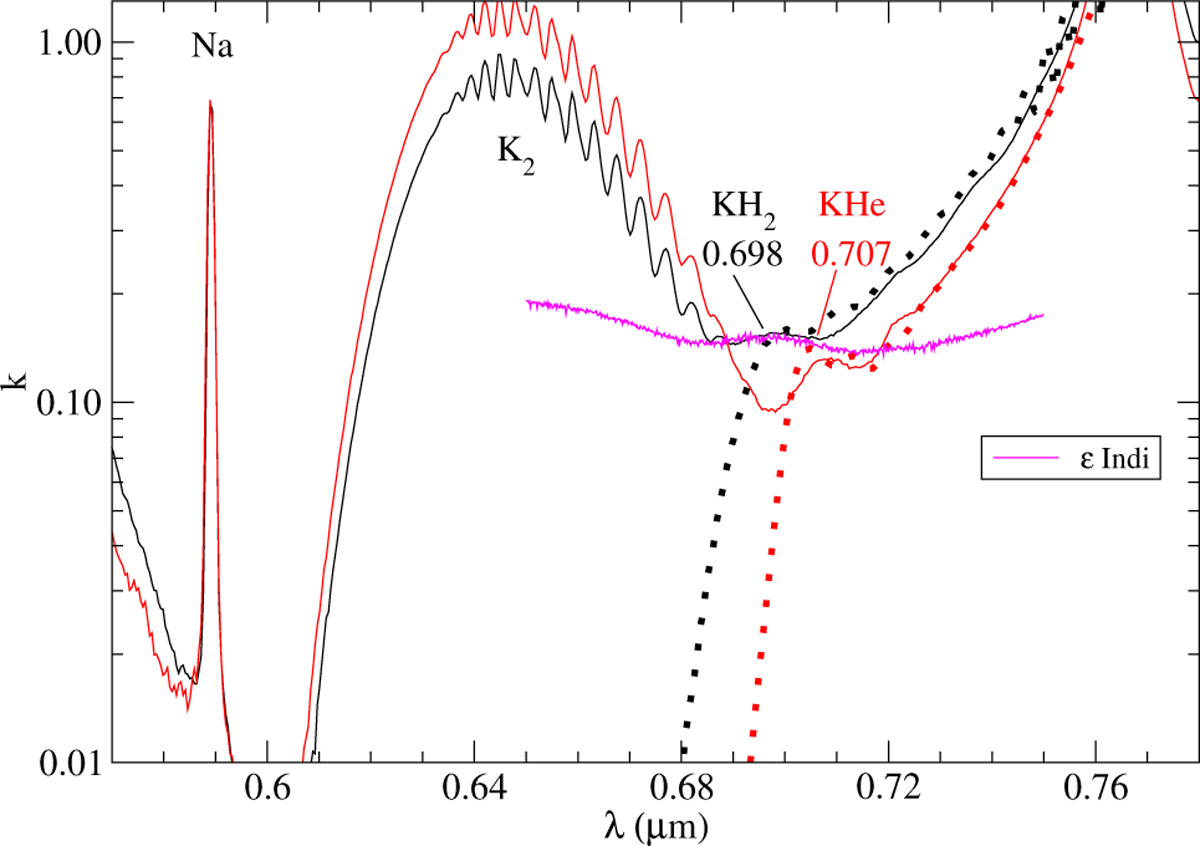
Comparison of the theoretical blue line wings of the resonance line of K (dotted lines) with the experimental spectra (full lines). The red curve represents K–He and the black curve represents K–H2. The density of perturbers is 1019 cm−3 at 800 K. The experimental spectra show the K2 dimer absorption. Detail of the spectrum of ϵ Indi Ba shows the blue satellite of the K resonance lines (observational data of Mark McCaughrean, as was described in Allard et al. 2007a).
Current usage metrics show cumulative count of Article Views (full-text article views including HTML views, PDF and ePub downloads, according to the available data) and Abstracts Views on Vision4Press platform.
Data correspond to usage on the plateform after 2015. The current usage metrics is available 48-96 hours after online publication and is updated daily on week days.
Initial download of the metrics may take a while.