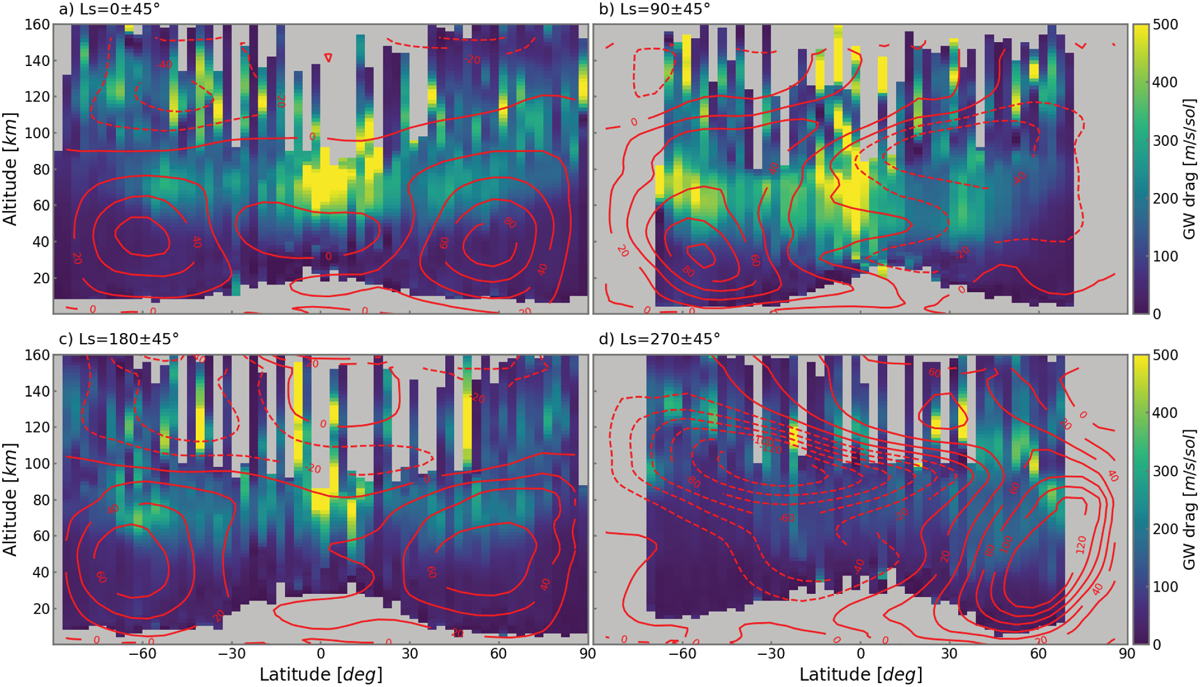
Fig. 5
Download original image
Same as in Fig. 4 but for the estimated momentum forcing (or GW drag) (shaded). Simulations with the MAOAM MGCM of the mean zonal wind corresponding to the same intervals of Ls are shown with contour lines. The solid and dashed lines represent eastward and westward winds, respectively. Data for the MY34 GDS period have been excluded.
Current usage metrics show cumulative count of Article Views (full-text article views including HTML views, PDF and ePub downloads, according to the available data) and Abstracts Views on Vision4Press platform.
Data correspond to usage on the plateform after 2015. The current usage metrics is available 48-96 hours after online publication and is updated daily on week days.
Initial download of the metrics may take a while.