Fig. 3
Download original image
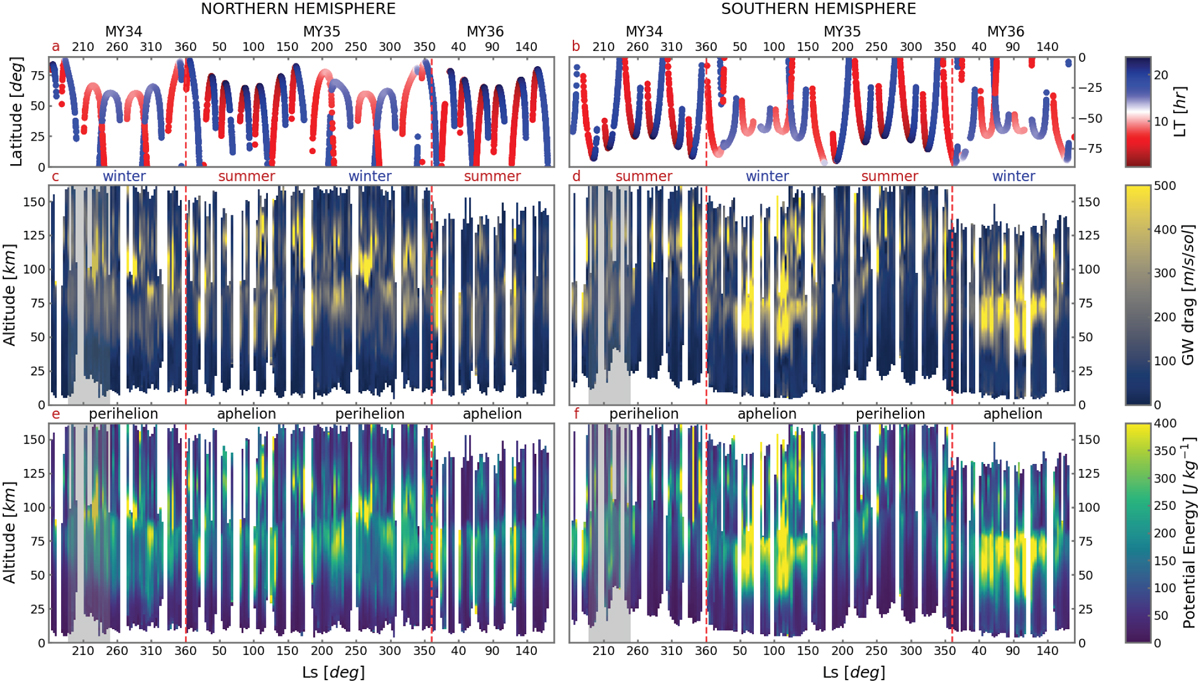
Seasonal distribution of the GW activity. Upper row: coverage of the ACS measurements as a function of the solar longitude Ls and latitude. The colors indicate the local time of observations. Middle and lower rows: seasonal-altitude distribution for the GW drag and potential energy (per unit mass), correspondingly. The left and right columns present the data for the northern and southern hemispheres, respectively. The gray area denotes the period of GDS. Red dashed lines separate the Martian years MY34, MY35, and MY36.
Current usage metrics show cumulative count of Article Views (full-text article views including HTML views, PDF and ePub downloads, according to the available data) and Abstracts Views on Vision4Press platform.
Data correspond to usage on the plateform after 2015. The current usage metrics is available 48-96 hours after online publication and is updated daily on week days.
Initial download of the metrics may take a while.