Fig. 2
Download original image
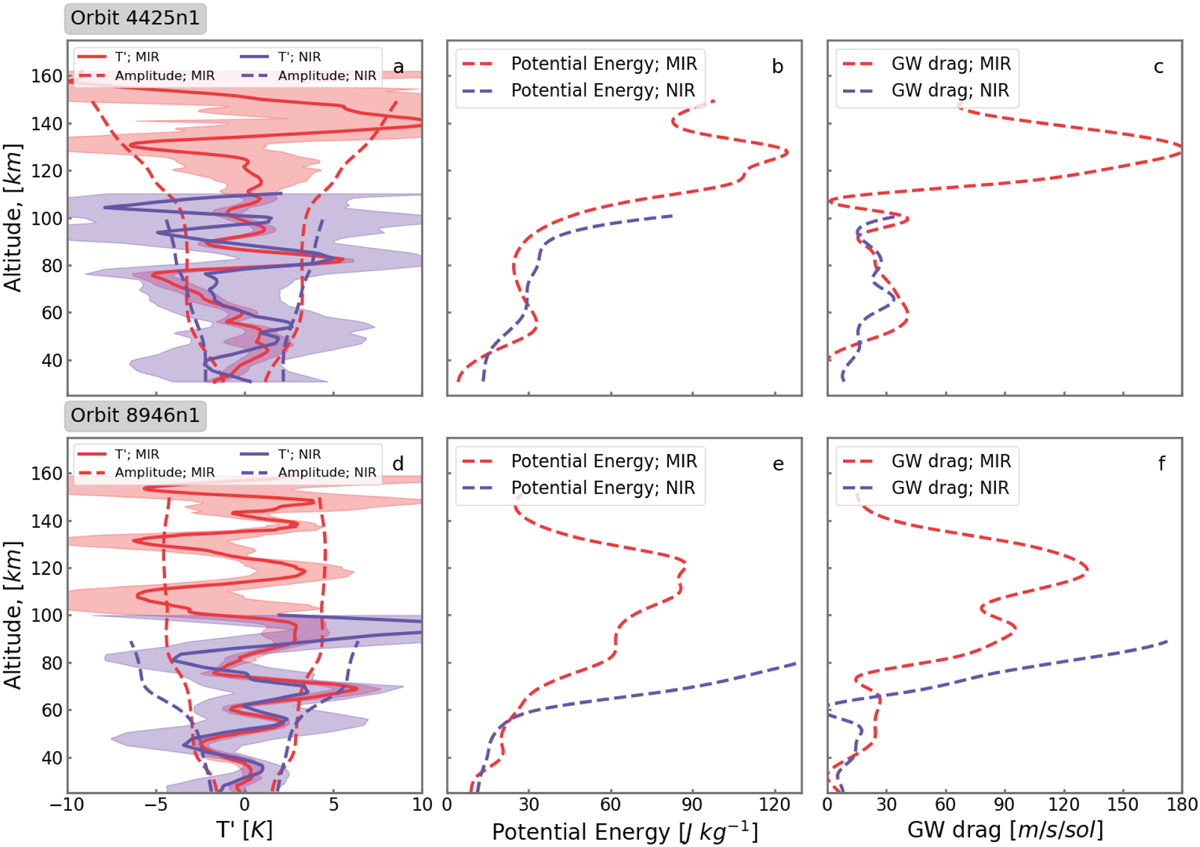
Wave characteristics retrieved for two representative measurements shown in Fig. 1: orbits 4425n2 (upper row) and 8946n1 (lower row). The red and blue colors distinguish the MIR and NIR data correspondingly. In the left column (a, d), the solid lines represent wave-induced distributions of temperature T', dashed lines are for the wave packet envelopes |T'|, and shades indicate the errors. The middle column (b, e) compares the potential energy profiles, while the right column (c, f) presents the estimated GW drag.
Current usage metrics show cumulative count of Article Views (full-text article views including HTML views, PDF and ePub downloads, according to the available data) and Abstracts Views on Vision4Press platform.
Data correspond to usage on the plateform after 2015. The current usage metrics is available 48-96 hours after online publication and is updated daily on week days.
Initial download of the metrics may take a while.