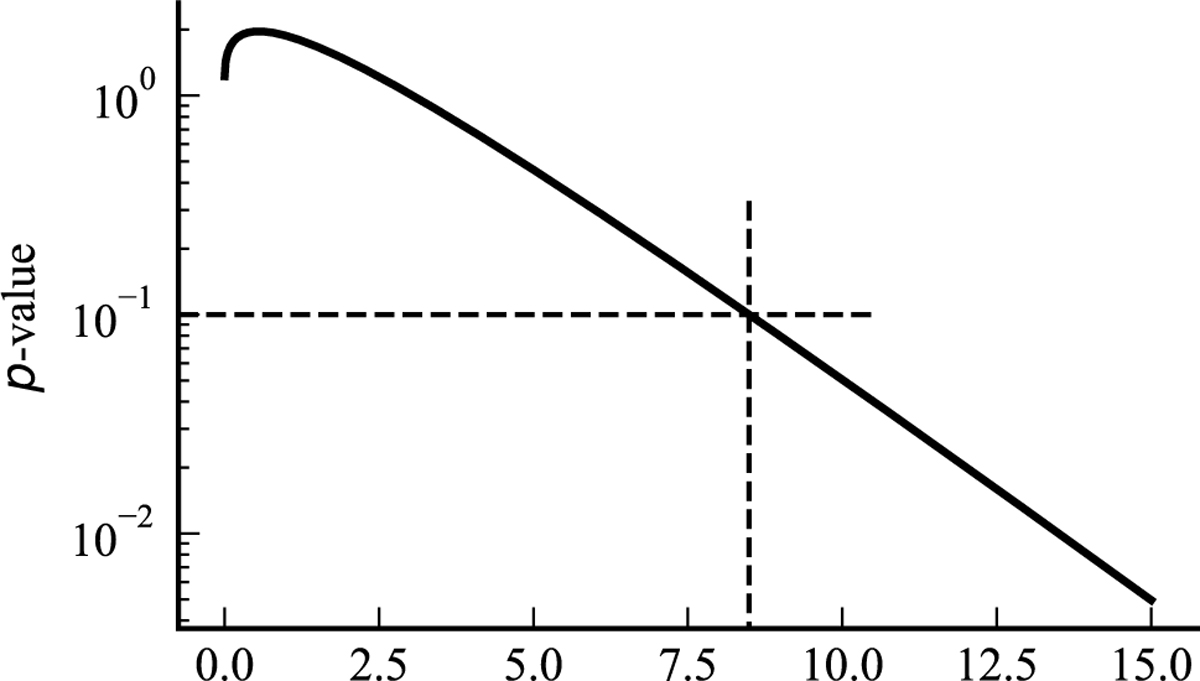
Fig. B.1
Download original image
Equation B.15 evaluated at different levels u, with the constants 𝒩1 = 2.3 ± 0.1 and 𝒩2 = 16.6 ± 0.2 estimated from 20 MC simulations. For each MC simulation, the parameter space S is dis-cretized in 400 evaluations. From this plot, we can conclude if Λ > 8.5, then the null hypothesis H0 is rejected at a 90% confidence level. It is important to note for small u, the estimated p-value is greater than 1, which for a probability is not possible. This is because the estimation drawn from Equation B.14 only applies to large u. In our case, the prediction for p-values < 10−1 is reasonable, as demonstrated by Vitells (2011, Figs. 2 & 6) in a similar context.
Current usage metrics show cumulative count of Article Views (full-text article views including HTML views, PDF and ePub downloads, according to the available data) and Abstracts Views on Vision4Press platform.
Data correspond to usage on the plateform after 2015. The current usage metrics is available 48-96 hours after online publication and is updated daily on week days.
Initial download of the metrics may take a while.