Fig. A.1
Download original image
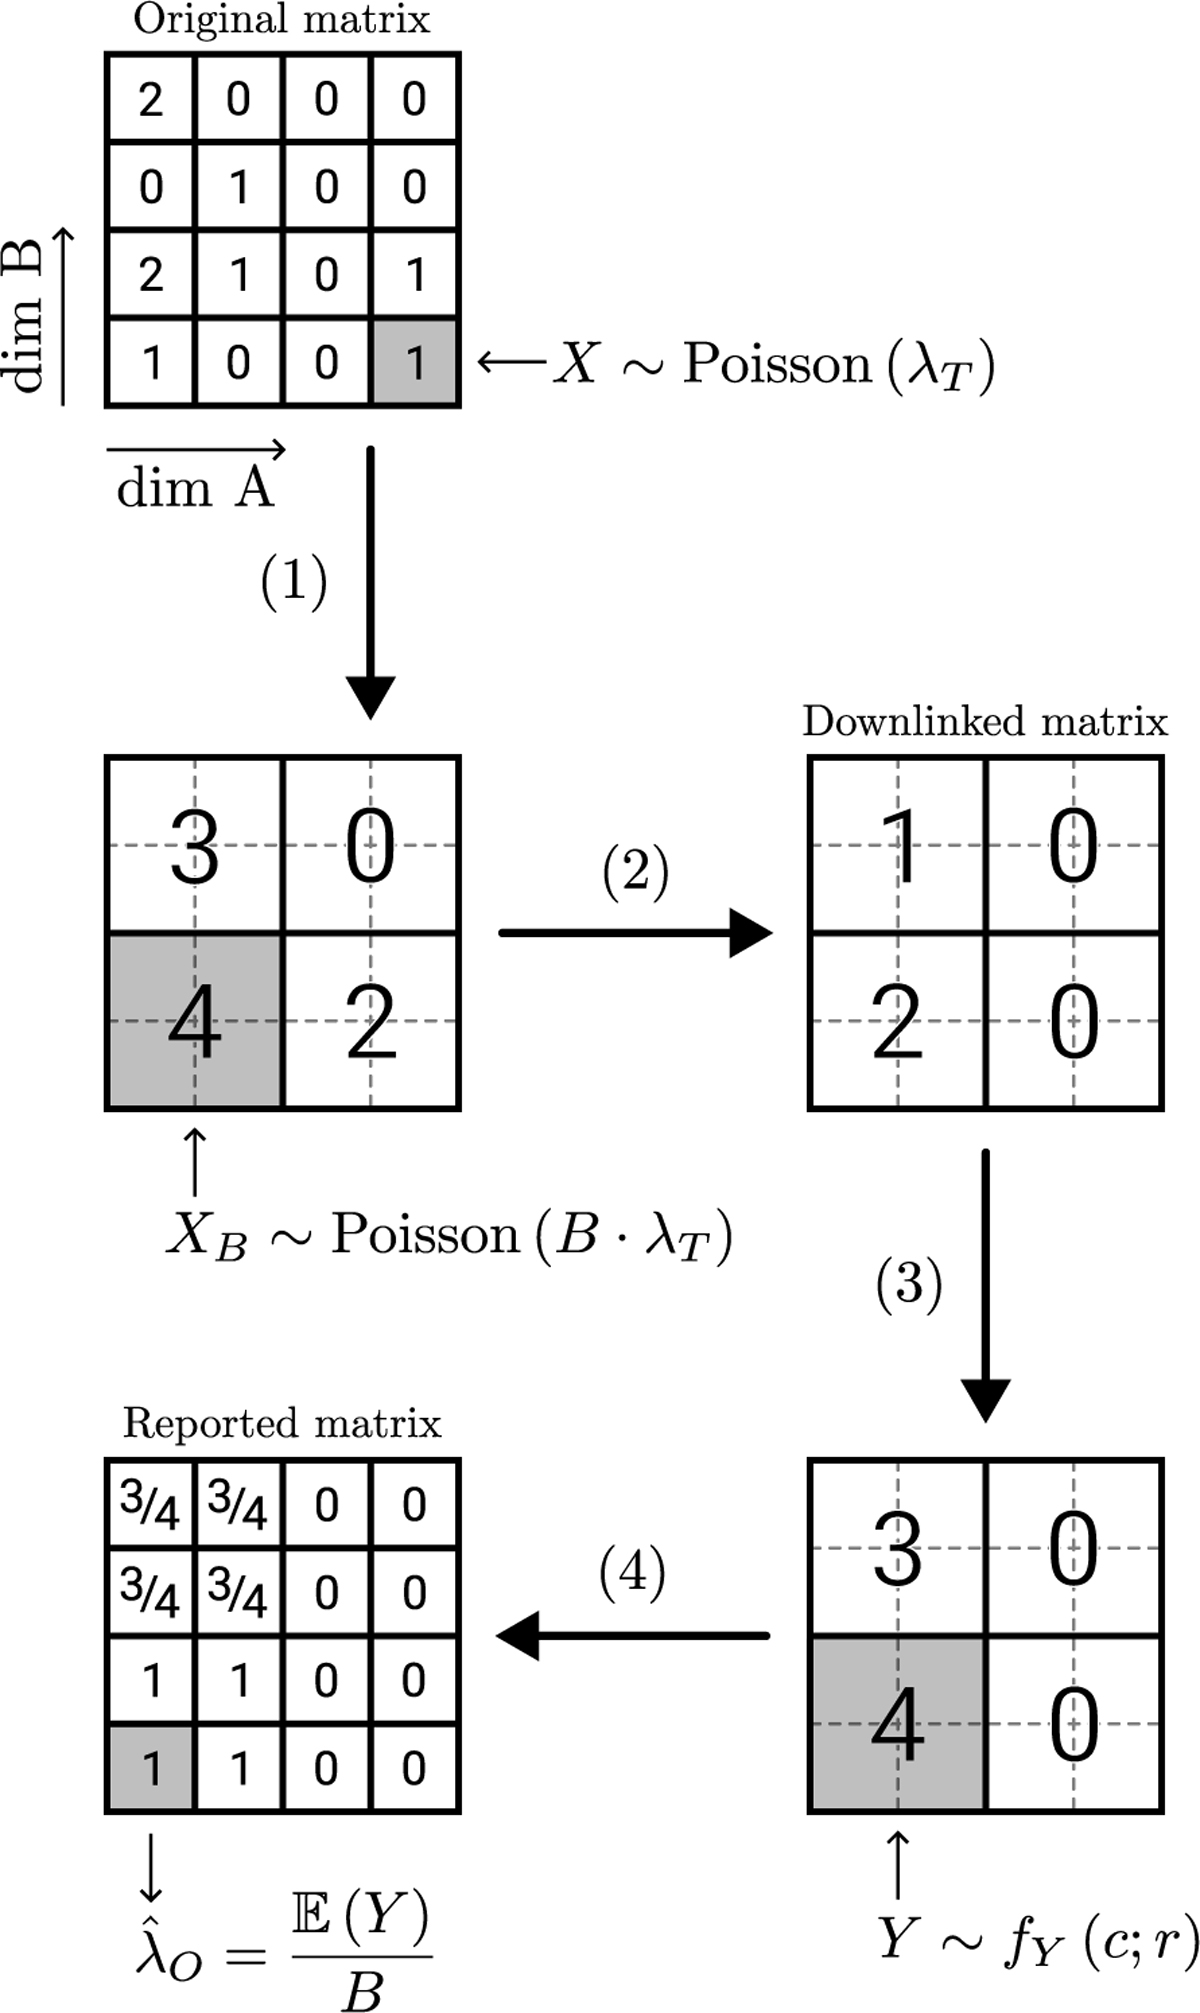
Flow diagram of the transformation of a matrix of counts, from the original matrix drawn from the observations of a process of mean λT to the reported matrix, used in this study. In this example, the count matrix is 2-dimensional, the background reduction level is r = 2 and the binning level is set to 2 along both dimensions, giving B = 4. There are four intermediate steps: (1) is the binned observation of the original count matrix from which we want to estimate the mean number of counts per bin λT . (2) is the application of the background reduction. The resulting matrix is the actual data product transmitted from spacecraft to ground. (3) is the application of the background-reduction correction, defined as: c + r if c ≠ 0, 0 otherwise, with c the number of counts. (4) is the uniform unbinning. It is clear the unbinning may result in fractional values, which cannot be treated as Poisson counts.
Current usage metrics show cumulative count of Article Views (full-text article views including HTML views, PDF and ePub downloads, according to the available data) and Abstracts Views on Vision4Press platform.
Data correspond to usage on the plateform after 2015. The current usage metrics is available 48-96 hours after online publication and is updated daily on week days.
Initial download of the metrics may take a while.