Fig. 6
Download original image
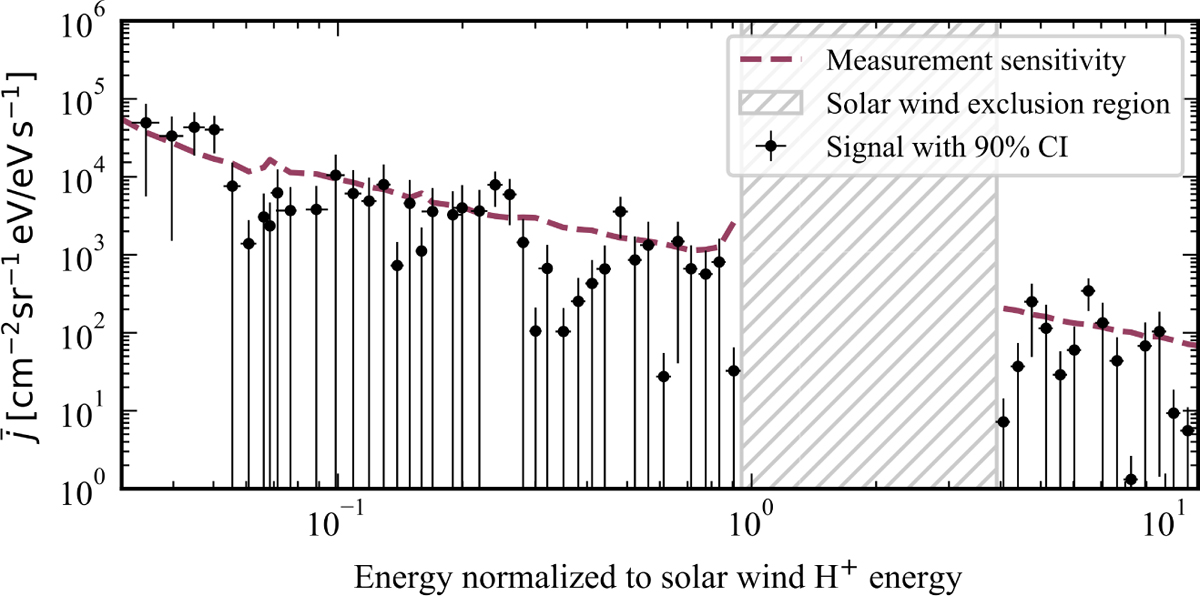
Time-average differential directional number flux energy spectrum of protons originating from the comet, after subtracting the background. The black dots represent the background-subtracted data, horizontal error bars represent the energy bin width and vertical error bars a 90% confidence interval. The dashed line represents the measurement sensitivity; any signal below this threshold is indistinguishable from background noise. The striped area covers the solar wind and has been masked out.
Current usage metrics show cumulative count of Article Views (full-text article views including HTML views, PDF and ePub downloads, according to the available data) and Abstracts Views on Vision4Press platform.
Data correspond to usage on the plateform after 2015. The current usage metrics is available 48-96 hours after online publication and is updated daily on week days.
Initial download of the metrics may take a while.