Fig. 2
Download original image
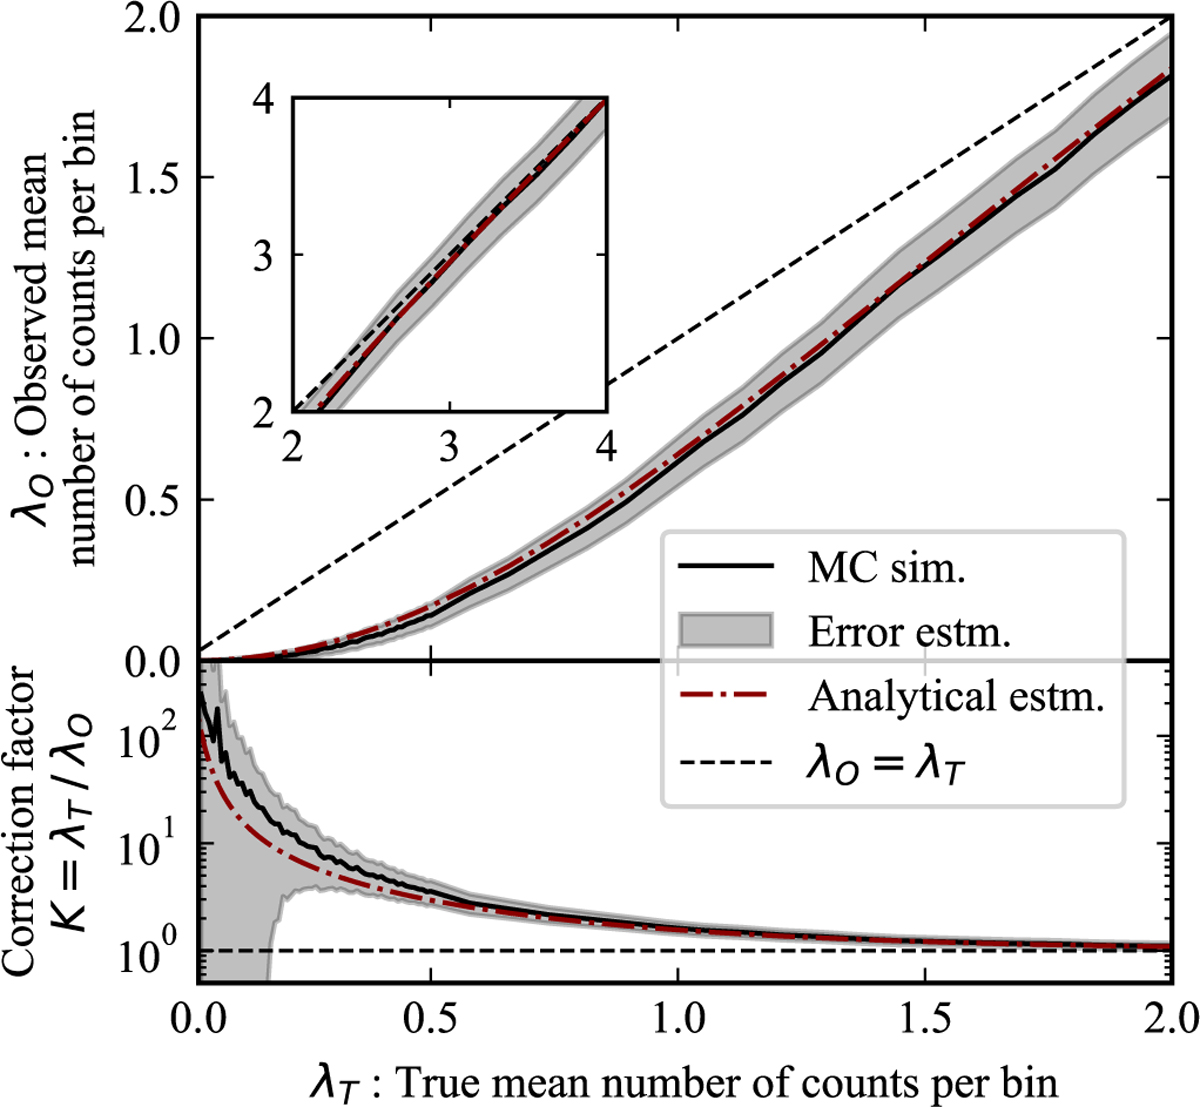
Observation bias due to the background reduction scheme. Both estimates from a Monte-Carlo simulation and the Eq. (A.4) are shown. Top panel: relation between the true mean number of counts λT, as detected by ICA, and the observed mean number of counts λ0, as reported by ICA after the background reduction and binning are applied. In this figure, the relation is averaged over all energies for clarity ; in a real application, the correction factor is different for each energy bin. The observed mean λ0 is significantly reduced for low true mean values λT. The deviation vanishes for larger λT ≳ 3 (inset). Bottom panel: ratio between the true mean number of counts and the observed mean number of counts. In all panels, the analytical estimate matches very well (within the MC uncertainties) the MC simulation, validating both approaches. The undistorted unit response is shown by the dashed line in all panels.
Current usage metrics show cumulative count of Article Views (full-text article views including HTML views, PDF and ePub downloads, according to the available data) and Abstracts Views on Vision4Press platform.
Data correspond to usage on the plateform after 2015. The current usage metrics is available 48-96 hours after online publication and is updated daily on week days.
Initial download of the metrics may take a while.