Fig. 3
Download original image
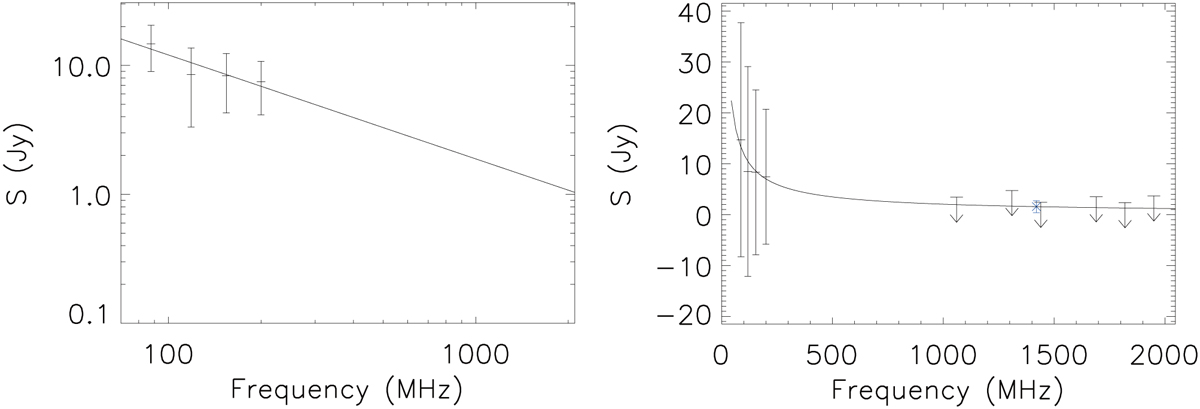
Flux densities of G16.11–0.51 obtained from the GLEAM data only (left) and the GLEAM+THOR+(THOR+VGPS) data (right). The flux density obtained from the THOR+VGPS 1.4 GHz continuum data is presented by a blue star in the right panel. The flux densities are extracted from the G16.11–0.51 region indicated in Fig. 2. An annular region half the beam size of the GLEAM 72–103 MHz data away from the source region, with an area similar to the source region, is used to subtract the background emission. The flux densities of H II regions, THOR radio continuum sources, and the SNR G16.0–0.5 region, all enlarged by half the beam size, are removed from the calculation (see regions in the right panel of Fig. 2). The axes in the left panel are logarithmic, while the ones in the right panel are linear. Internal and external flux density scale errors are applied as 2% and 8% for the GLEAM data in left and right panels, respectively (Hurley-Walker et al. 2017). The flux density uncertainty of the THOR and THOR+VGPS data is determined by measuring the variation of the emission free region (see Anderson et al. 2017 for reference). The fit power-law spectra are shown by solid lines. The best-fit spectral indices are –0.8 ± 0.3 and –0.77 ± 0.04 for the GLEAM and GLEAM+(THOR+VGPS) data, respectively. The upper limits of the flux densities from the THOR only data are shown for comparison but are not used in fitting.
Current usage metrics show cumulative count of Article Views (full-text article views including HTML views, PDF and ePub downloads, according to the available data) and Abstracts Views on Vision4Press platform.
Data correspond to usage on the plateform after 2015. The current usage metrics is available 48-96 hours after online publication and is updated daily on week days.
Initial download of the metrics may take a while.