Fig. 2
Download original image
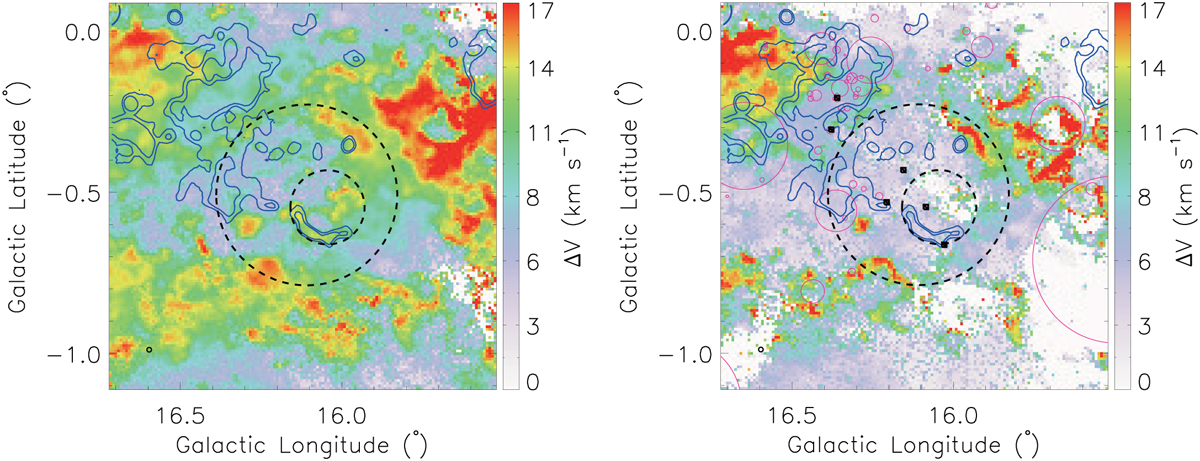
Velocity dispersion (moment 2) maps of 12CO (left) and 13CO (right) line emission over the velocity range from +40 to +60 km s−1, overlaid with the GLEAM 170–230 MHz radio-continuum-emission contours (~2'.25 angular resolution). The contour levels are 0.76 and 0.81 Jy beairr–1. The black dashed circles are the same as in Fig. 1, indicating the extent of G16.11–0.51 and SNR G16.0–0.5, respectively. The H II regions are indicated by magenta circles in the right panel, and all are introduced from the WISE catalog of Galactic H II regions (Anderson et al. 2014), which is one of the most complete catalogs of H II regions in the Galaxy. Radio-continuum sources extracted from the THOR survey are marked by black solid boxes (Bihr et al. 2016; Wang et al. 2018).
Current usage metrics show cumulative count of Article Views (full-text article views including HTML views, PDF and ePub downloads, according to the available data) and Abstracts Views on Vision4Press platform.
Data correspond to usage on the plateform after 2015. The current usage metrics is available 48-96 hours after online publication and is updated daily on week days.
Initial download of the metrics may take a while.