Fig. 1
Download original image
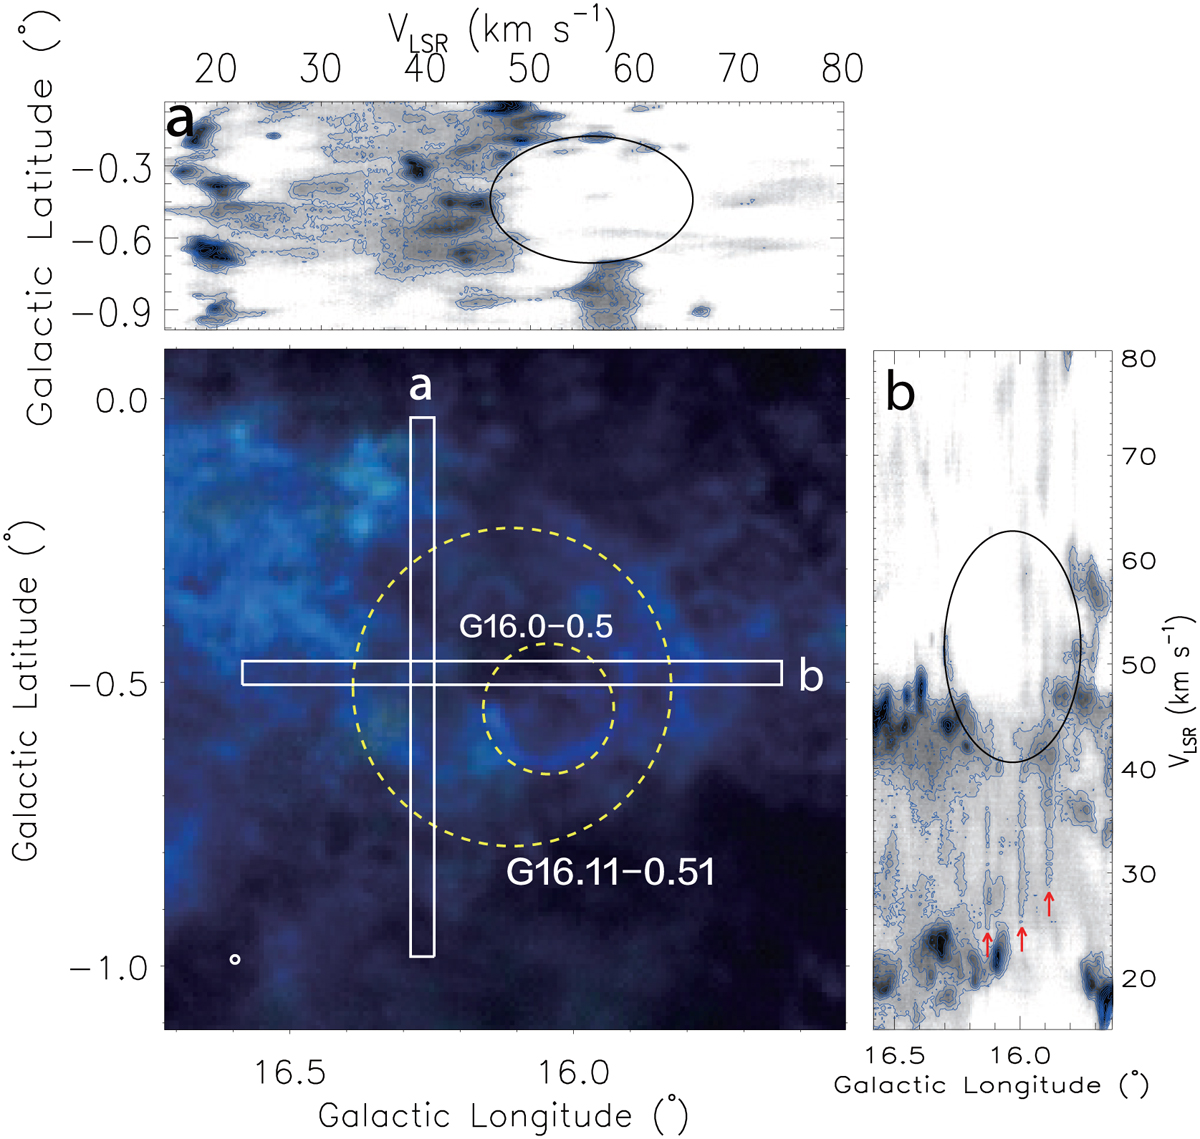
Integrated intensity and position-velocity maps of CO emission toward G16.11–0.51. Bottom left panel: pseudo-tricolor image of the integrated intensity of 12CO (J = 1–0) (blue), 13CO (J = 1–0) (green), and C18O(J = 1–0) (red) line emission in the velocity range from +35 to +85 km s−1. The intensities of all three CO lines have confidence levels over 5σ. The large and small yellow dashed circles indicate the extent of G16.11–0.51 and SNR G16.0–0.5, respectively. The beam is represented by a white circle in the lower left corner. The top and right panels show the 12CO (J = 1 –0) position-velocity maps along the strips indicated in the intensity map. The minimum value of the background grayscale map is 1σ, and the contour levels are from 3σ and in a step of 1σ. Black ellipses indicate structures of expanding molecular gas around the boundary of G16.11–0.51. Three red arrows in the right panel mark the locations of three examples of broadened CO lines associated with G16.11–0.51.
Current usage metrics show cumulative count of Article Views (full-text article views including HTML views, PDF and ePub downloads, according to the available data) and Abstracts Views on Vision4Press platform.
Data correspond to usage on the plateform after 2015. The current usage metrics is available 48-96 hours after online publication and is updated daily on week days.
Initial download of the metrics may take a while.