Fig. 4
Download original image
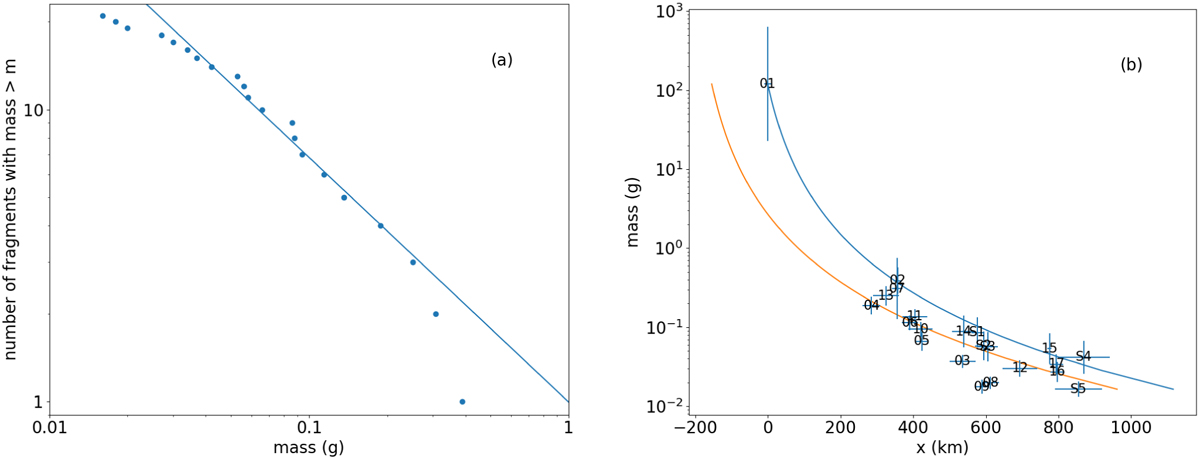
Mass distribution and shift of fragments. (a) Cumulative mass distribution of fragments. The line corresponds to N(>m) ∝ m−0.84, i.e. D = 2.52, and it is the fit for fragment masses in the range of 0.03–0.3 g. (b) Shift of fragments from the parent meteoroid in the antisolar direction as a function of mass. The error bars correspond to uncertainty intervals of 2σ. The blue curve corresponds to the theoretical displacement of fragments due to solar radiation pressure for a cluster age of 10.6 days if the ejection velocities were zero. The deviations of the fragment positions from this curve are caused by the projection of the non-zero ejection velocity into the solar/antisolar direction. If all ejection velocities were 0.39 m s−1 in the direction of the ejection cone axis (i.e., 66° from the direction to the Sun), the theoretical dependence of the displacement on mass would follow the orange curve.
Current usage metrics show cumulative count of Article Views (full-text article views including HTML views, PDF and ePub downloads, according to the available data) and Abstracts Views on Vision4Press platform.
Data correspond to usage on the plateform after 2015. The current usage metrics is available 48-96 hours after online publication and is updated daily on week days.
Initial download of the metrics may take a while.