Fig. 2
Download original image
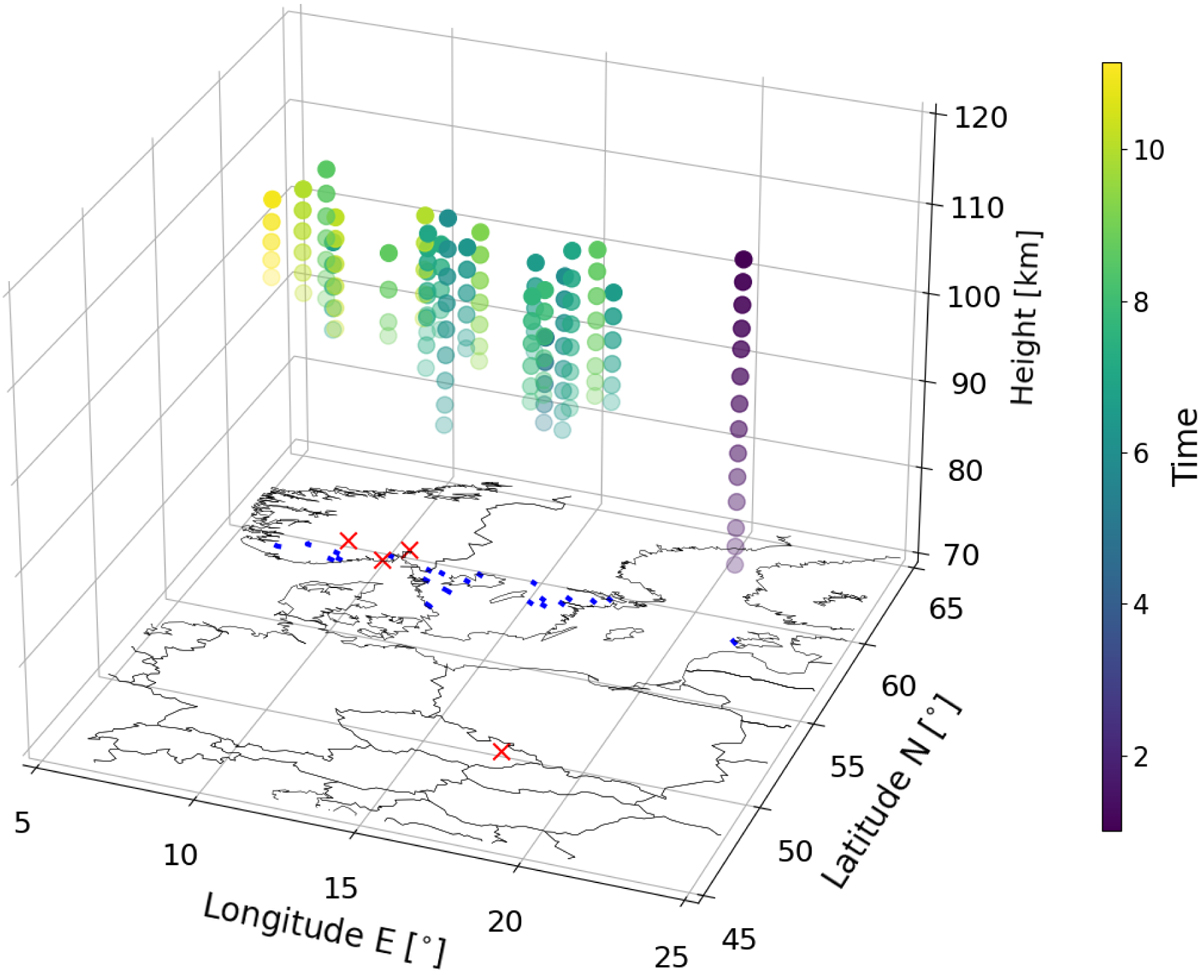
3D representation of meteor atmospheric trajectories and their projection on a map of Europe. The time from the start of the first meteor expressed in seconds is colour coded. A total of 17 multi-station and 5 single-station meteors are shown. The positions of the stations are plotted as red crosses. The scale on the x and y axes is much smaller than on the 𝓏 axis, so the projections of meteor trajectories onto the Earth’s surface are very short.
Current usage metrics show cumulative count of Article Views (full-text article views including HTML views, PDF and ePub downloads, according to the available data) and Abstracts Views on Vision4Press platform.
Data correspond to usage on the plateform after 2015. The current usage metrics is available 48-96 hours after online publication and is updated daily on week days.
Initial download of the metrics may take a while.