Fig. A.2
Download original image
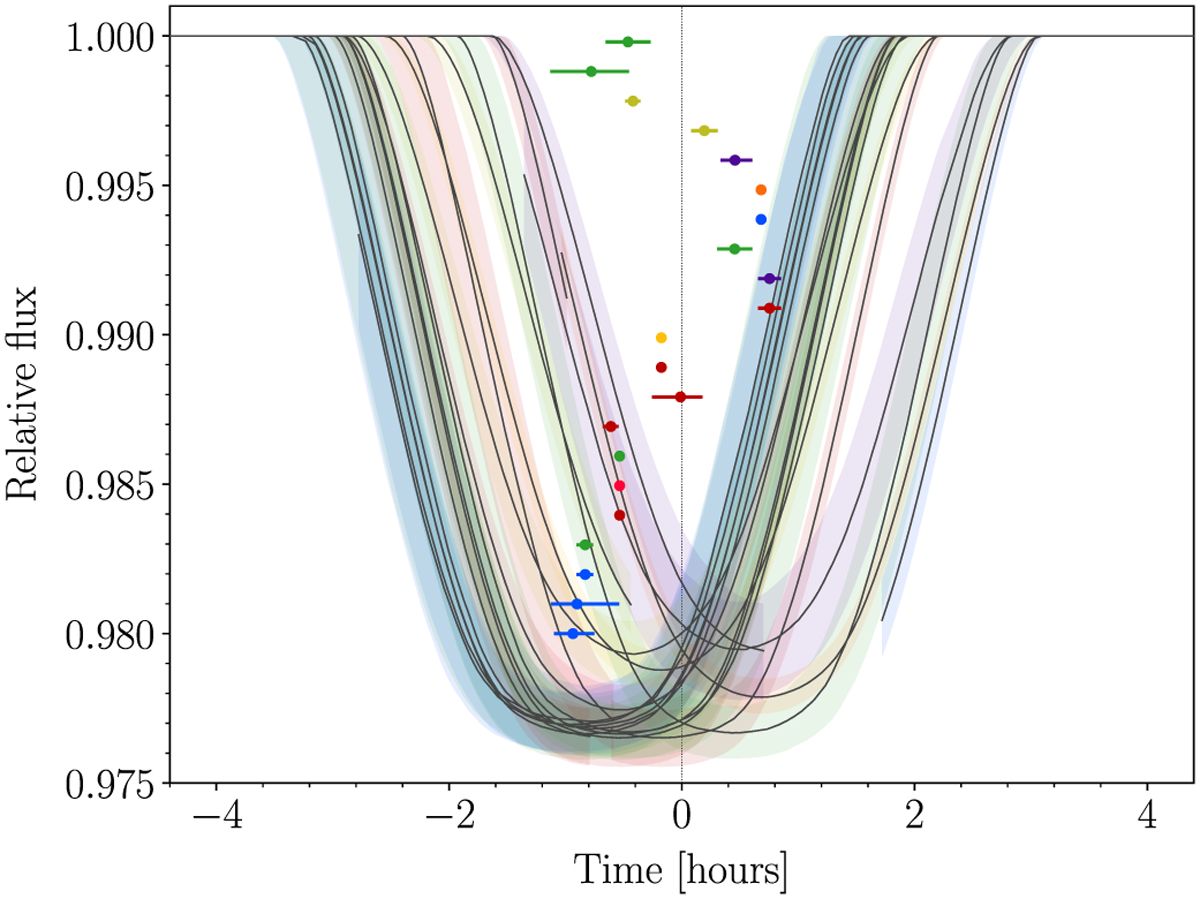
Posterior of the transit models for each epoch and band (Sect. 3, TTV analysis with a single Rp/R★), with the median represented as a black line and the 68% credible interval shown in various colors corresponding to Fig. 1, excludes epoch 16. Each transit is centered relative to the MAP value of the linear ephemeris derived in Sect. 4.1. The horizontal error bars indicate the mid-transit time offset from the linear ephemeris, shifted vertically, with time increasing from top to bottom.
Current usage metrics show cumulative count of Article Views (full-text article views including HTML views, PDF and ePub downloads, according to the available data) and Abstracts Views on Vision4Press platform.
Data correspond to usage on the plateform after 2015. The current usage metrics is available 48-96 hours after online publication and is updated daily on week days.
Initial download of the metrics may take a while.