Fig. 4
Download original image
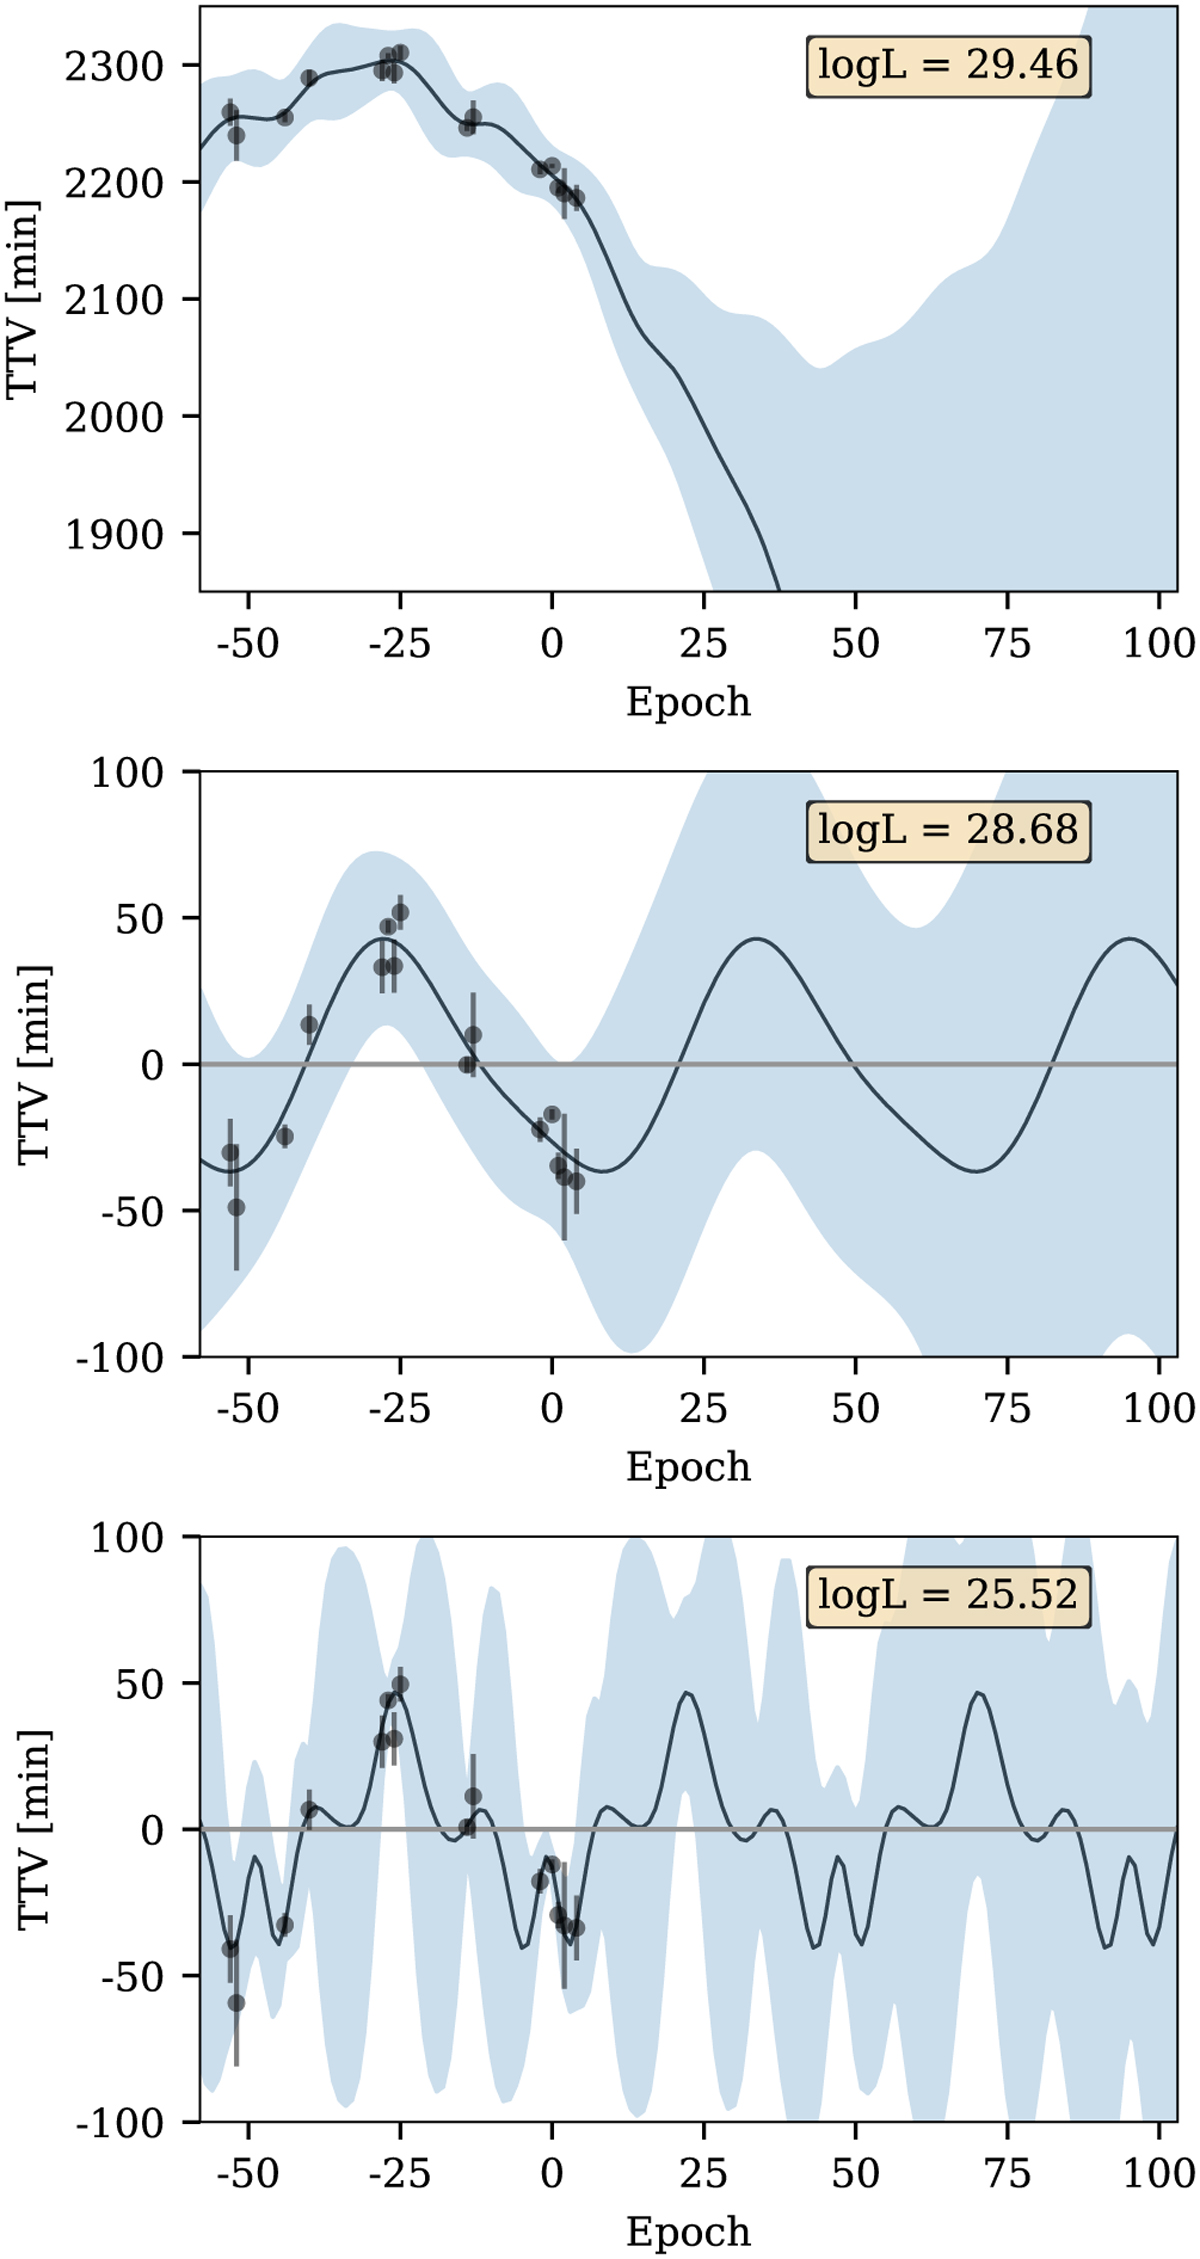
GP regression of the time variations in excess of mean linear ephemeris. The results are shown for kernels “per + long + white” (top), “per + white” (middle), and “per” (bottom). The black curve represents the posterior GP mean and the blue-shaded area represents the 3σ region for each epoch. The epoch number is relative to epoch 53.
Current usage metrics show cumulative count of Article Views (full-text article views including HTML views, PDF and ePub downloads, according to the available data) and Abstracts Views on Vision4Press platform.
Data correspond to usage on the plateform after 2015. The current usage metrics is available 48-96 hours after online publication and is updated daily on week days.
Initial download of the metrics may take a while.