Fig. 3
Download original image
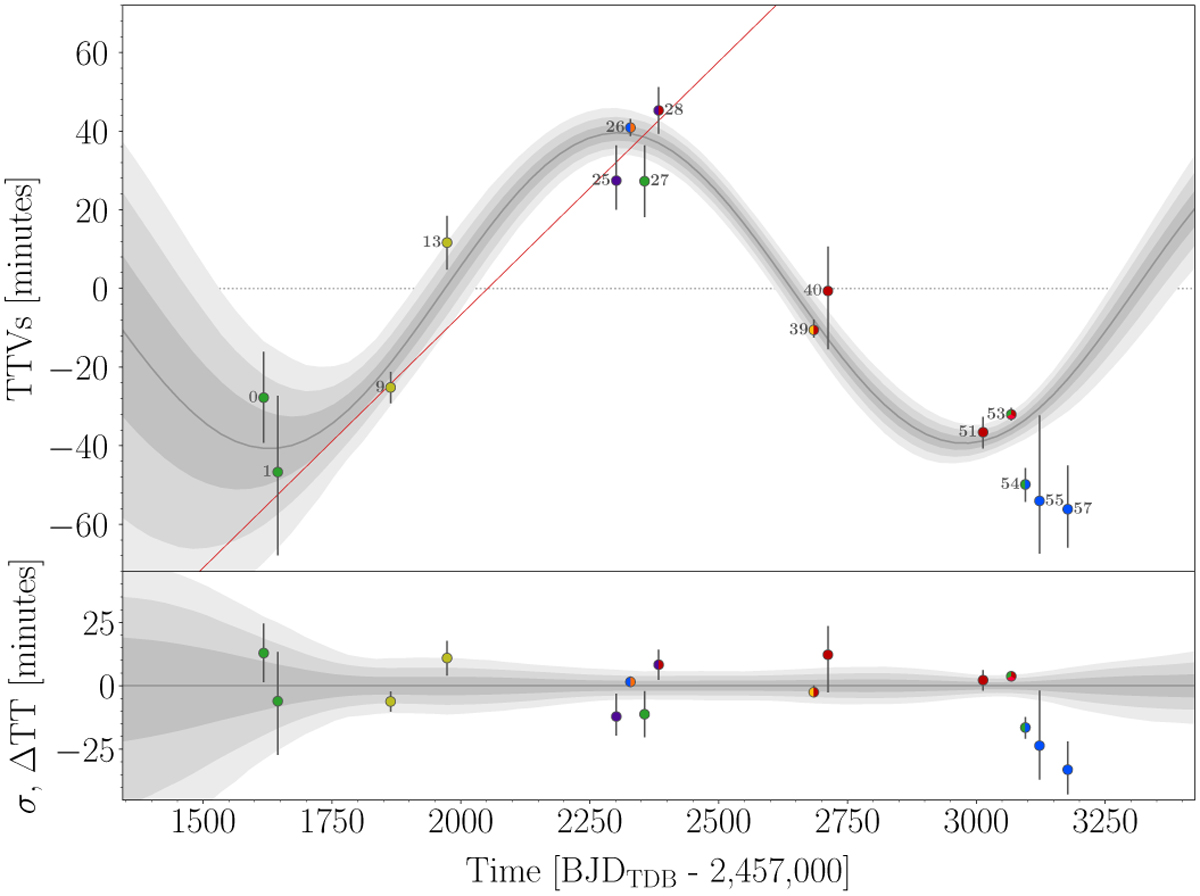
Posterior TTVs of TOI-1227 b computed relative to a linear ephemeris (from the MAP value of the sinusoidal model) are shown with black error bars (Sect. 3). In the upper panel, the TTVs’ sinusoidal model (median, 1, 2, and 3σ, in gray) is shown and compared with individual transit-time determinations (Sect. 3, median and 68% CI, the colors of the dots indicate the observing band as in Fig. 1). The linear ephemeris from Mann et al. (2022) is shown as a red line. In the lower panel, the posterior median of the TTVs’ model was subtracted to visualize the uncertainty of the distribution and to allow for better comparison with the individual transit-time determinations.
Current usage metrics show cumulative count of Article Views (full-text article views including HTML views, PDF and ePub downloads, according to the available data) and Abstracts Views on Vision4Press platform.
Data correspond to usage on the plateform after 2015. The current usage metrics is available 48-96 hours after online publication and is updated daily on week days.
Initial download of the metrics may take a while.