Fig. 2
Download original image
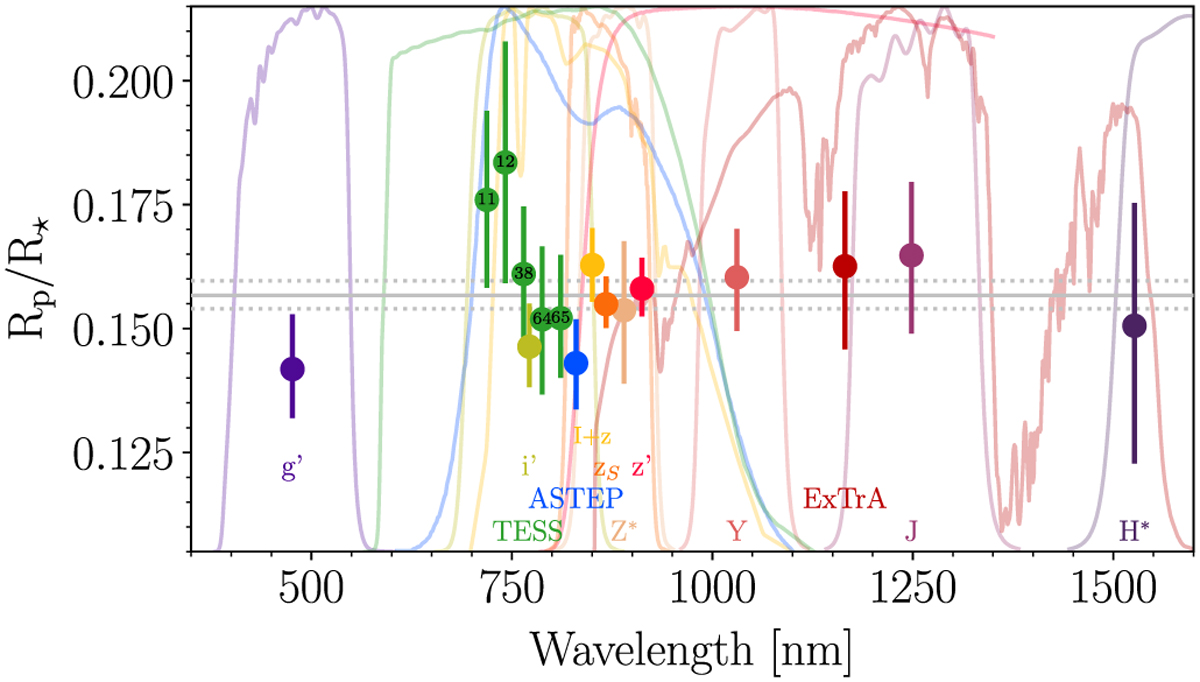
Posterior distribution comparison for Rp/R⋆ (error bars) computed for different bands (whose transmission curves are shown and labeled with different colors) and TESS sectors (shifted horizontally for visualization purposes, the TESS sector number is noted inside the dots). All transits were fitted jointly with a separate Rp/R⋆ parameter for each band. The horizontal solid and dotted gray lines represent the posterior median and 68.3% CI assuming a common Rp/R⋆ (Sect. 3).
Current usage metrics show cumulative count of Article Views (full-text article views including HTML views, PDF and ePub downloads, according to the available data) and Abstracts Views on Vision4Press platform.
Data correspond to usage on the plateform after 2015. The current usage metrics is available 48-96 hours after online publication and is updated daily on week days.
Initial download of the metrics may take a while.