Fig. 1
Download original image
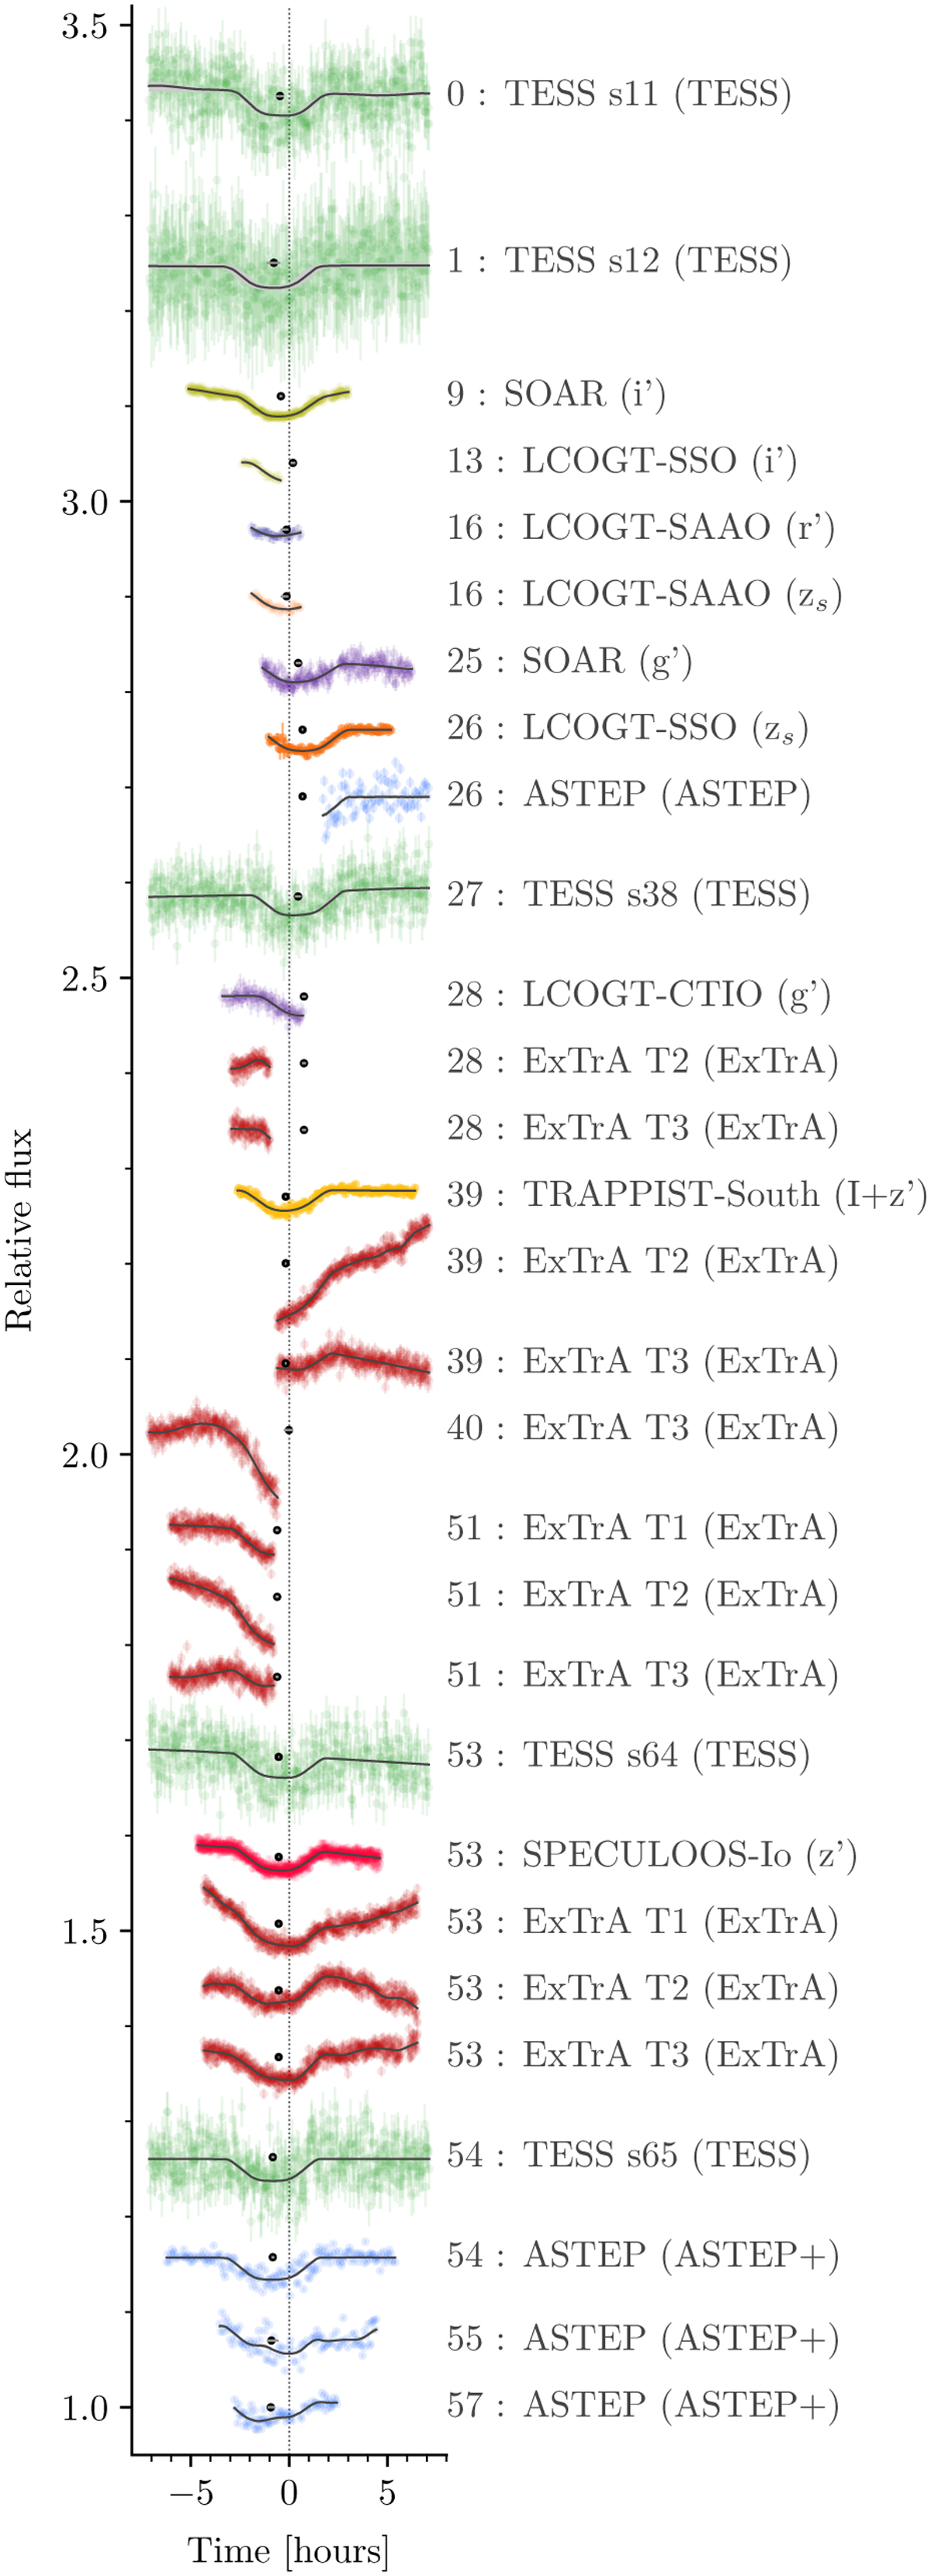
Transit observations (vertical error bars) with the model that combines both transit and noise (median as a black line and 68% interval in gray), arbitrarily shifted vertically. Each transit observation is labeled with the transit epoch, the telescope, and the observing band. Each transit is centered relative to the maximum a posteriori value of the linear ephemeris derived in Sect. 4.1. Horizontal error bars show the mid-transit time offset from the linear ephemeris.
Current usage metrics show cumulative count of Article Views (full-text article views including HTML views, PDF and ePub downloads, according to the available data) and Abstracts Views on Vision4Press platform.
Data correspond to usage on the plateform after 2015. The current usage metrics is available 48-96 hours after online publication and is updated daily on week days.
Initial download of the metrics may take a while.