Fig. 4.
Download original image
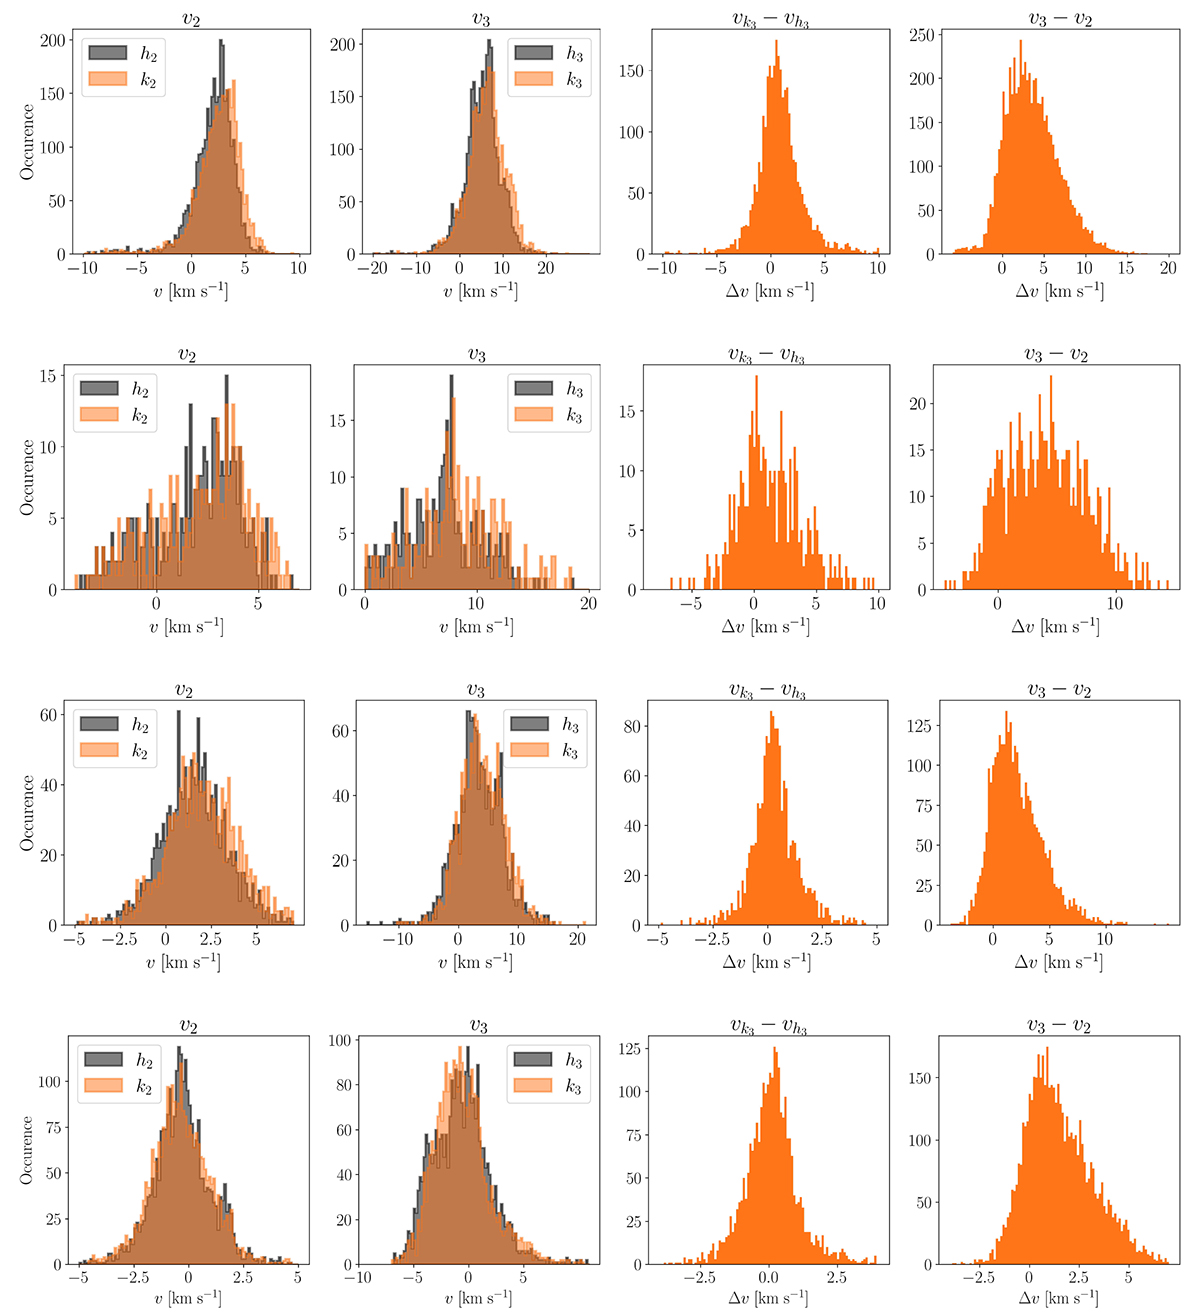
Velocity diagnostics. Each row represents a different observation, from observation 1 to 4 in ascending order from the top to the bottom. The first two columns represent the distribution of the LoS velocity as measured in the position of the emission peaks (first column) and in the line core (second column). The third column shows the distribution of the relative values of the line core velocities between the h & k lines, and the fourth column shows the relative velocity as measured in the line core and the emission peaks.
Current usage metrics show cumulative count of Article Views (full-text article views including HTML views, PDF and ePub downloads, according to the available data) and Abstracts Views on Vision4Press platform.
Data correspond to usage on the plateform after 2015. The current usage metrics is available 48-96 hours after online publication and is updated daily on week days.
Initial download of the metrics may take a while.