Fig. 3.
Download original image
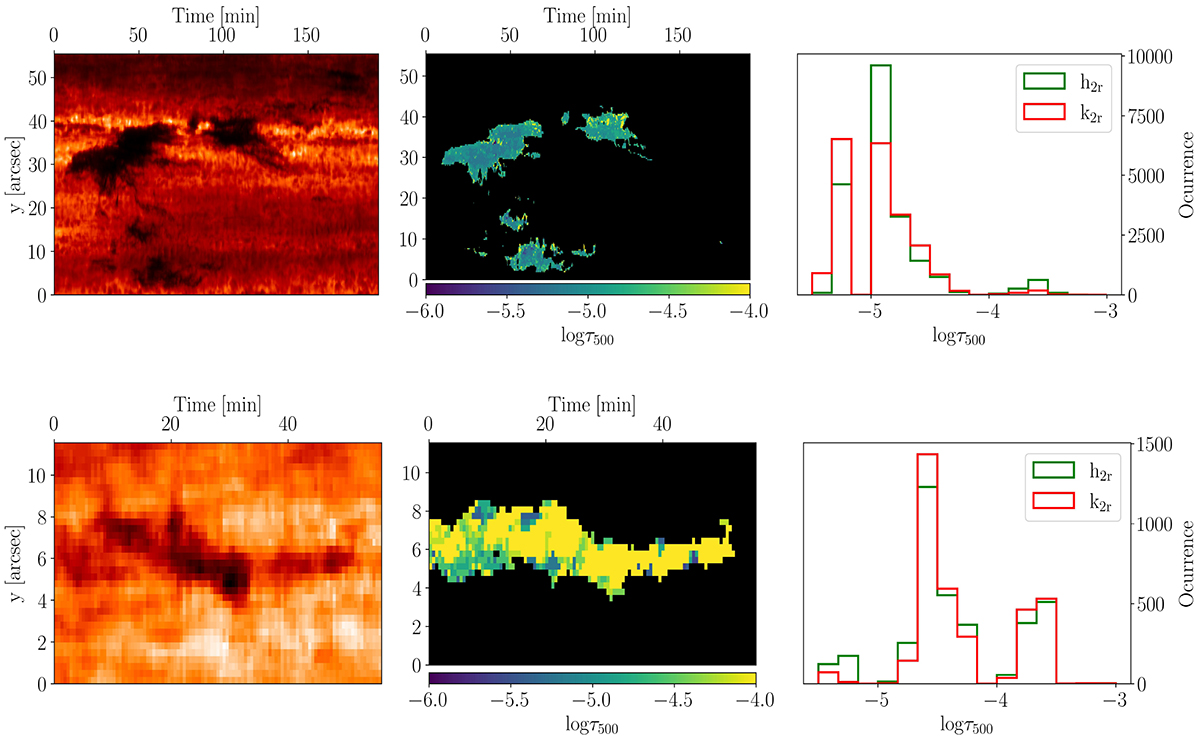
Response functions. Left columns display the line core intensity in the Mg II k line as a function of time, with the top one referring to observation 7, and the bottom to observation 9. The middle panels show the optical depth of maximum response to temperature in these observations for the h2r feature. The right columns show the distributions of maximum response to temperature for each observation, in each case, for both h2r and k2r features.
Current usage metrics show cumulative count of Article Views (full-text article views including HTML views, PDF and ePub downloads, according to the available data) and Abstracts Views on Vision4Press platform.
Data correspond to usage on the plateform after 2015. The current usage metrics is available 48-96 hours after online publication and is updated daily on week days.
Initial download of the metrics may take a while.