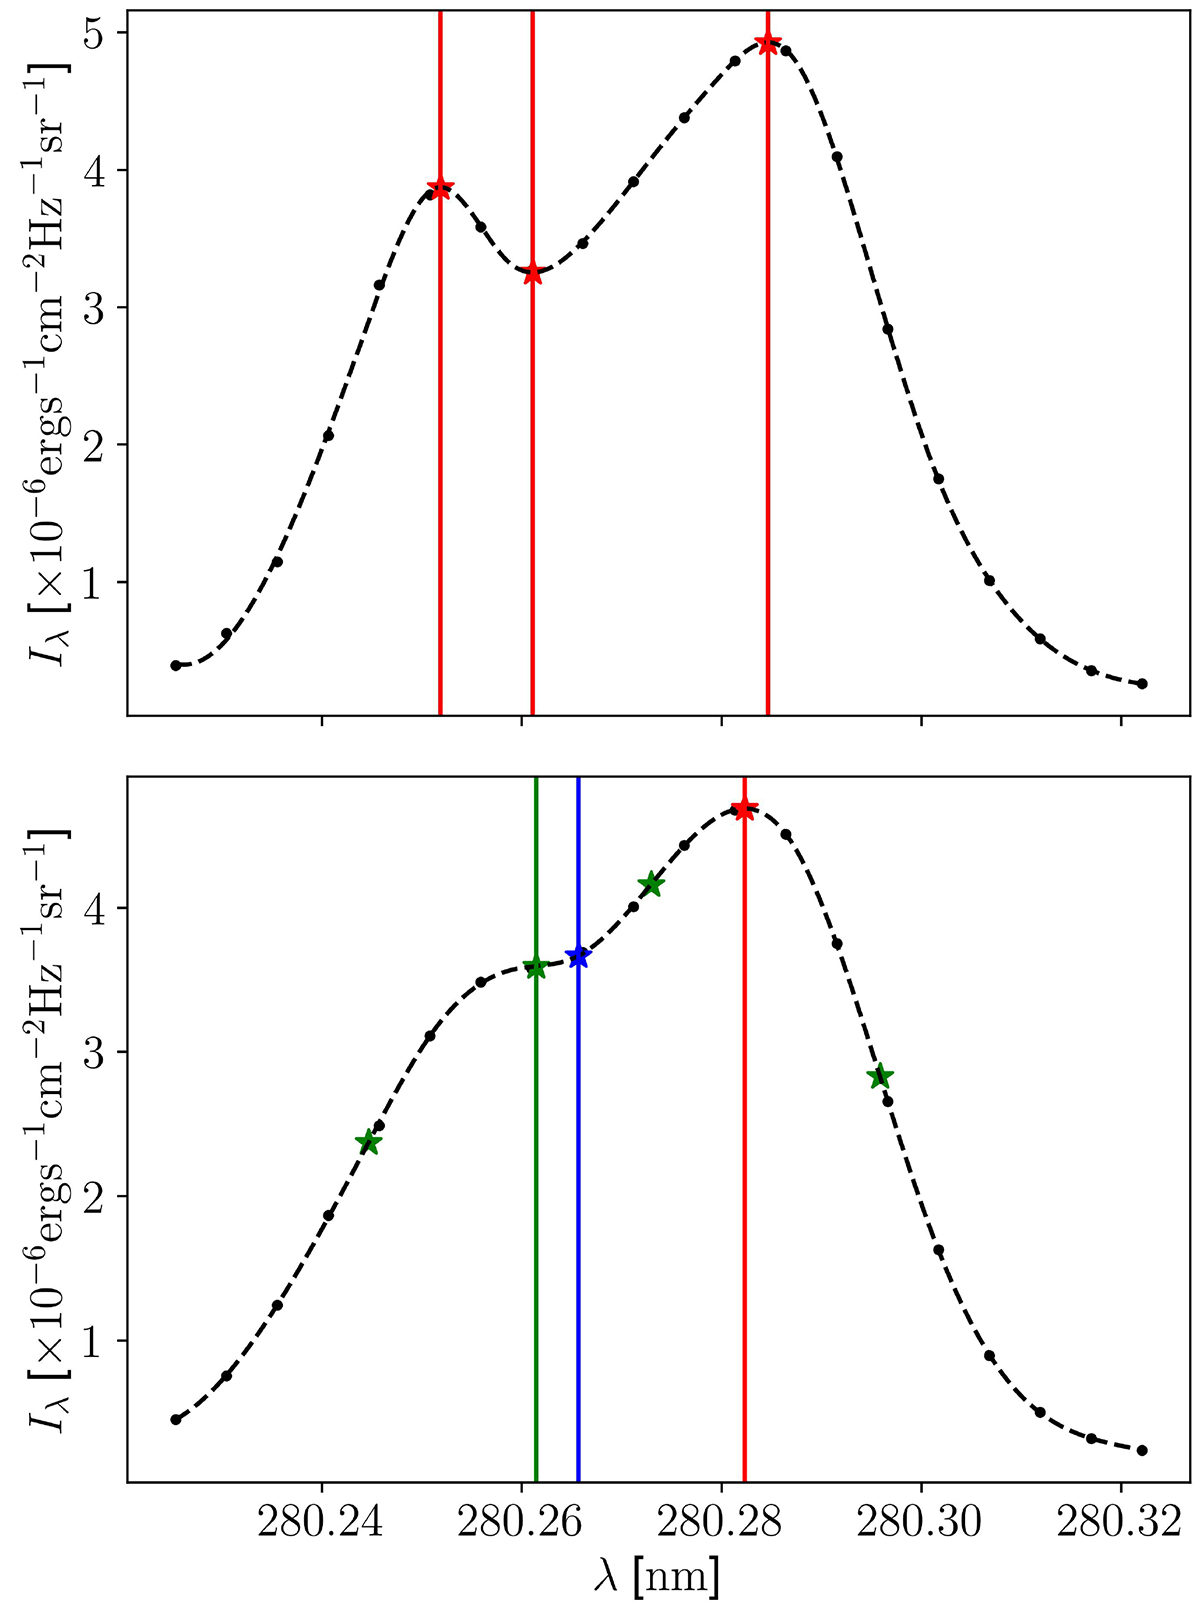
Fig. 2.
Download original image
Spectral features, featuring a typical Mg II h line profile with two emission peaks and a line core minimum (shown in the top panel) and a single-peaked profile (shown in the bottom panel). The positions of the extremes of the fitted profile are marked with a red star, with the vertical red lines denoting the retrieved h3 and h2 features. For the single-peaked profile, the position of the only extreme is also marked with a red star, while the extremes of the first and second derivatives are marked with green and blue stars, respectively. The vertical lines also identify the retrieved h3 and h2 features. The black dashed curves in both panels represent the fitted curve to the spectral profile, with the black dots representing observed spectral points.
Current usage metrics show cumulative count of Article Views (full-text article views including HTML views, PDF and ePub downloads, according to the available data) and Abstracts Views on Vision4Press platform.
Data correspond to usage on the plateform after 2015. The current usage metrics is available 48-96 hours after online publication and is updated daily on week days.
Initial download of the metrics may take a while.